
In this article, I will touch on a topic that many traders first get acquainted with quite late in their training, but can often help increase the chance of becoming profitable dramatically.
Many traders have heard the quotes:
Let the trend be your friend
and
Never trade against the trend
But how do you make “the trend be your friend” and how do you avoid “trading against the trend”?
One of the answers is to use multiple time frames when trading.
The use of multiple timeframes
The concept of using different timeframes in your daily trading is quite simple. I work with the concepts “trend chart” and “timing chart”. The trend chart is the chart with the longest timeframe and the timing chart is the one with the shortest timeframe.
The idea is to use a timeframe (the longest of the chosen ones) to spot the overall trend in the market, and then use the second (the short timeframe) for timing the trades.
A rule of thumb is that your “trend chart” should be about 3-6 times as long a timeframe as your “timing chart”.
That means, if you want to time your trading on a 5-min chart, your trend chart should be 15-30 minutes.
If your favourite chart is 15 minutes, for example, a 1-hour chart is good as a trend chart.
Let me give you an example.
5 and 1-min charts in trading
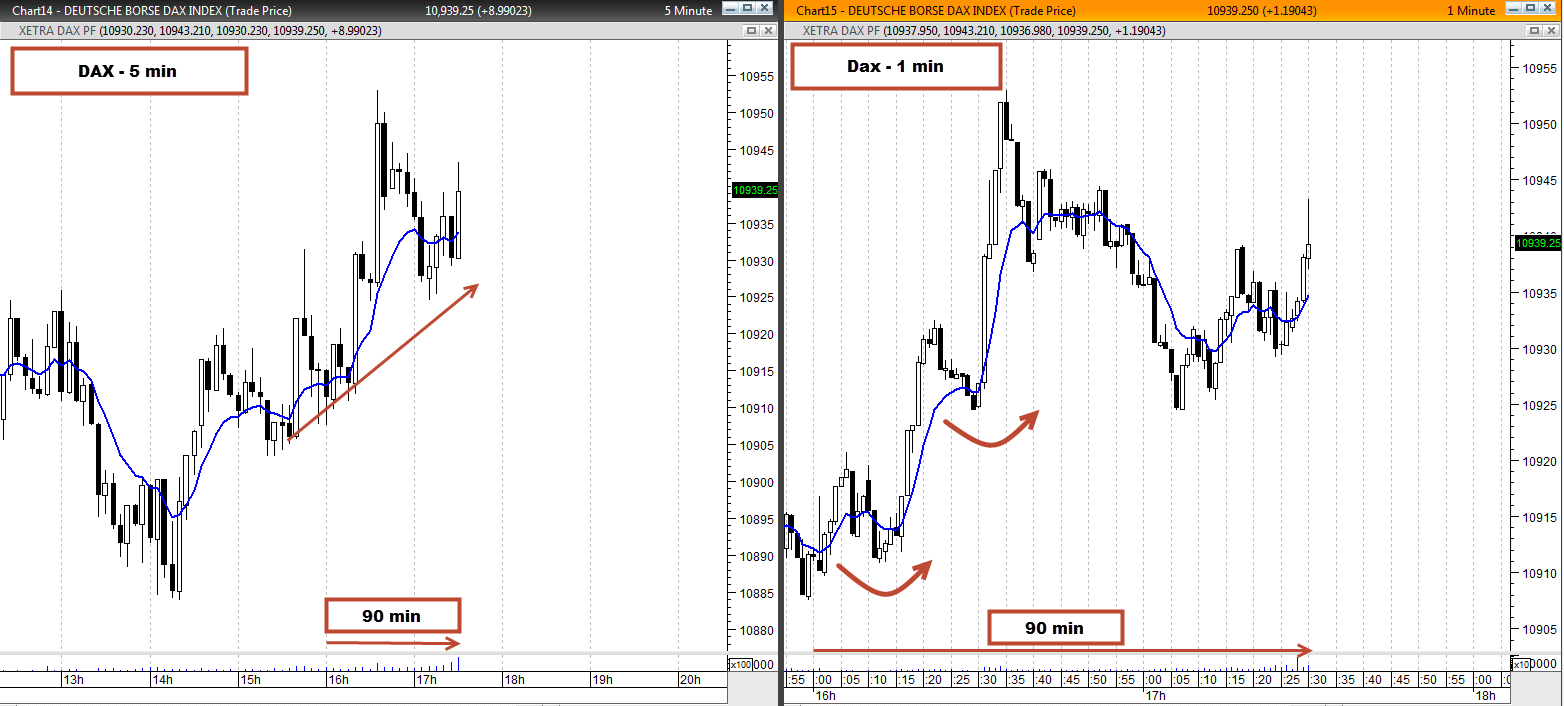
Here you will see two charts put together.
To the left we have a 5-min chart (each bar on the chart equals 5 min.) And to the right we see the 1-min chart (each bar is 1 min data).
What you have to do when you trade is that you are not going to “go long” (ie you are aiming for the market to rise) while the overall market is falling.
In the example, I have marked a 90-minute timeframe at the bottom with an arrow so you can see what time I’m working with. So the short arrow on the left chart corresponds temporarily to the long arrow on the right chart.
Once you’ve spotted a bull trend (upward trend) on the 5-min chart on the left, then the basic rule is that you only take bull-trades (bet on increases) in the chart to the right.
So if we are convinced that the market is on its way up, then we switch to the 1-min chart and look for some waves in the market where the price has pulled back a bit and now indicates that it would rise again. Here we must only look for turns upwards and then take a trade in that direction.
If we see a setup on the 1-min chart indicating that we’re going down, then we’ll revert to the 5-min chart. If it is still in an overall uptrend, then we should never take a short trade (bet on a fall), because then we trade against the general market trend.
You can see a little more detail about how I use these concepts in my daily trading in the video here: