The second leg of a two legged bull flag formed in a three push pattern ending at the 0% line. A double bottom and higher lows before price rallied to the 50% line. Price broke the resistance and made a 100% expansion on the initial bear leg. Look how the price in the final push after the second trade rallied in a strong three bar push with no pullback. Late in a trend that is usually a exhaustion push. A good sign for profit taking. Now price is trading sideways. The first push down. We could see a second leg down to the trendline, potentially a measured move equal to the first bear leg, or a 100% expansion.
15 min chart:
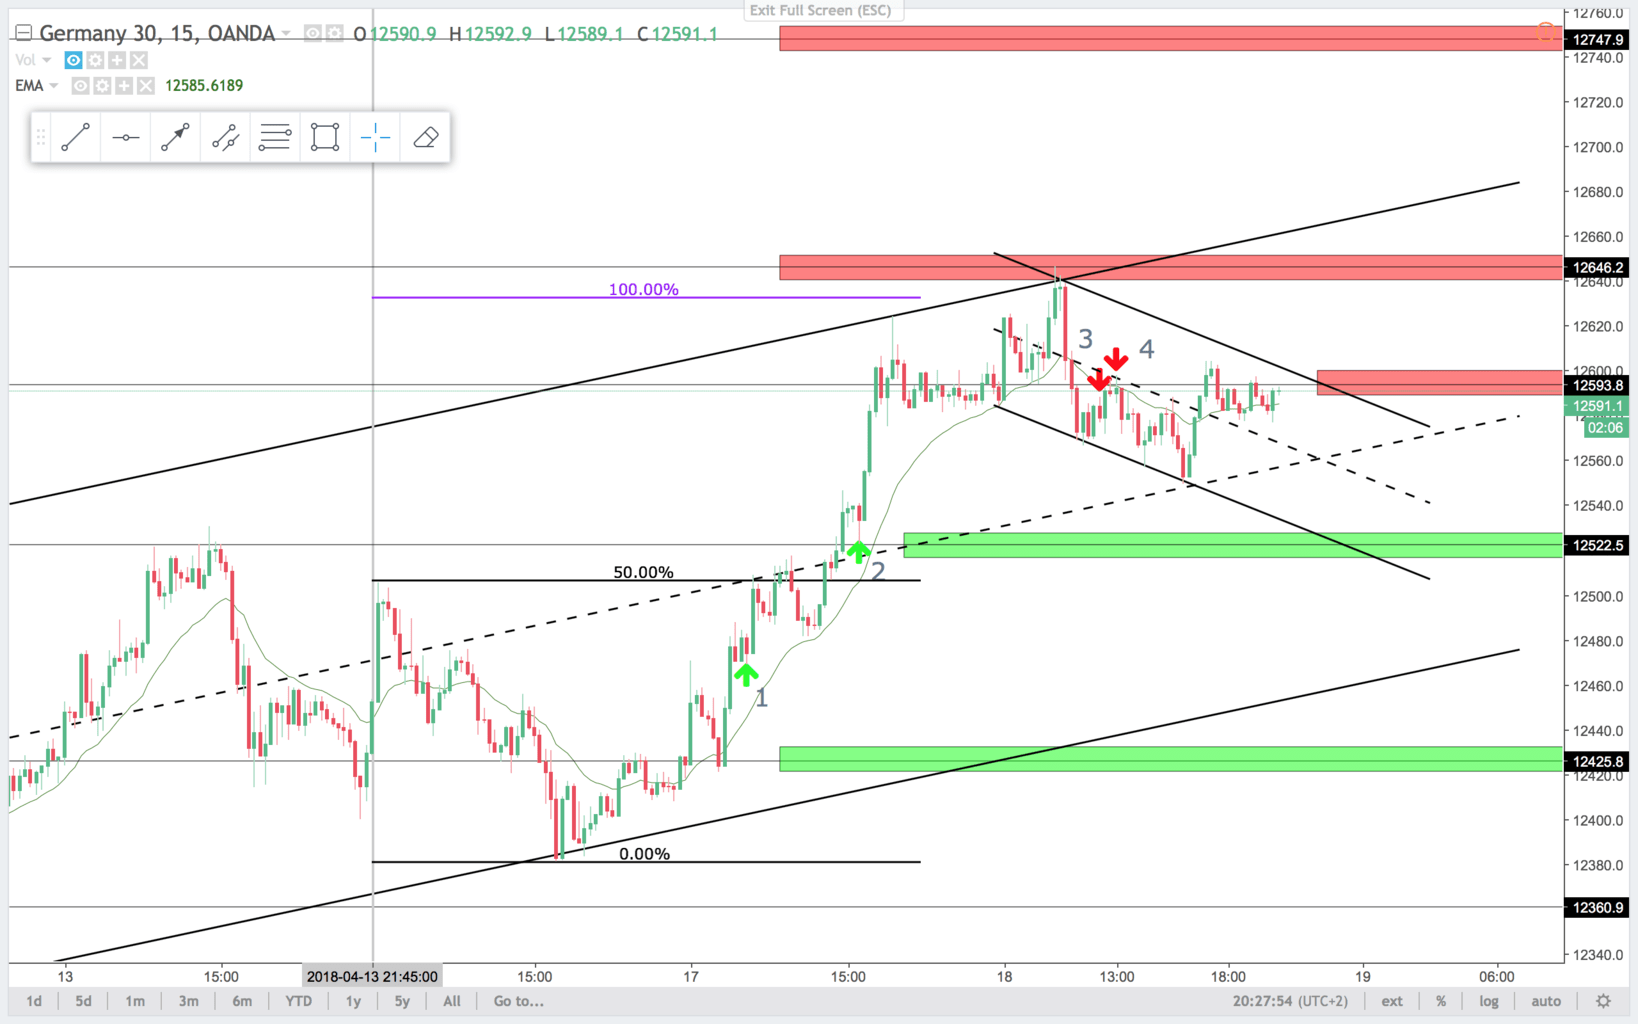
Trade 1:
On the 15 min chart you see a hidden two leg correction. Sideways pause after two strong bull bars. You can buy this bull flag of the 15 min chart.
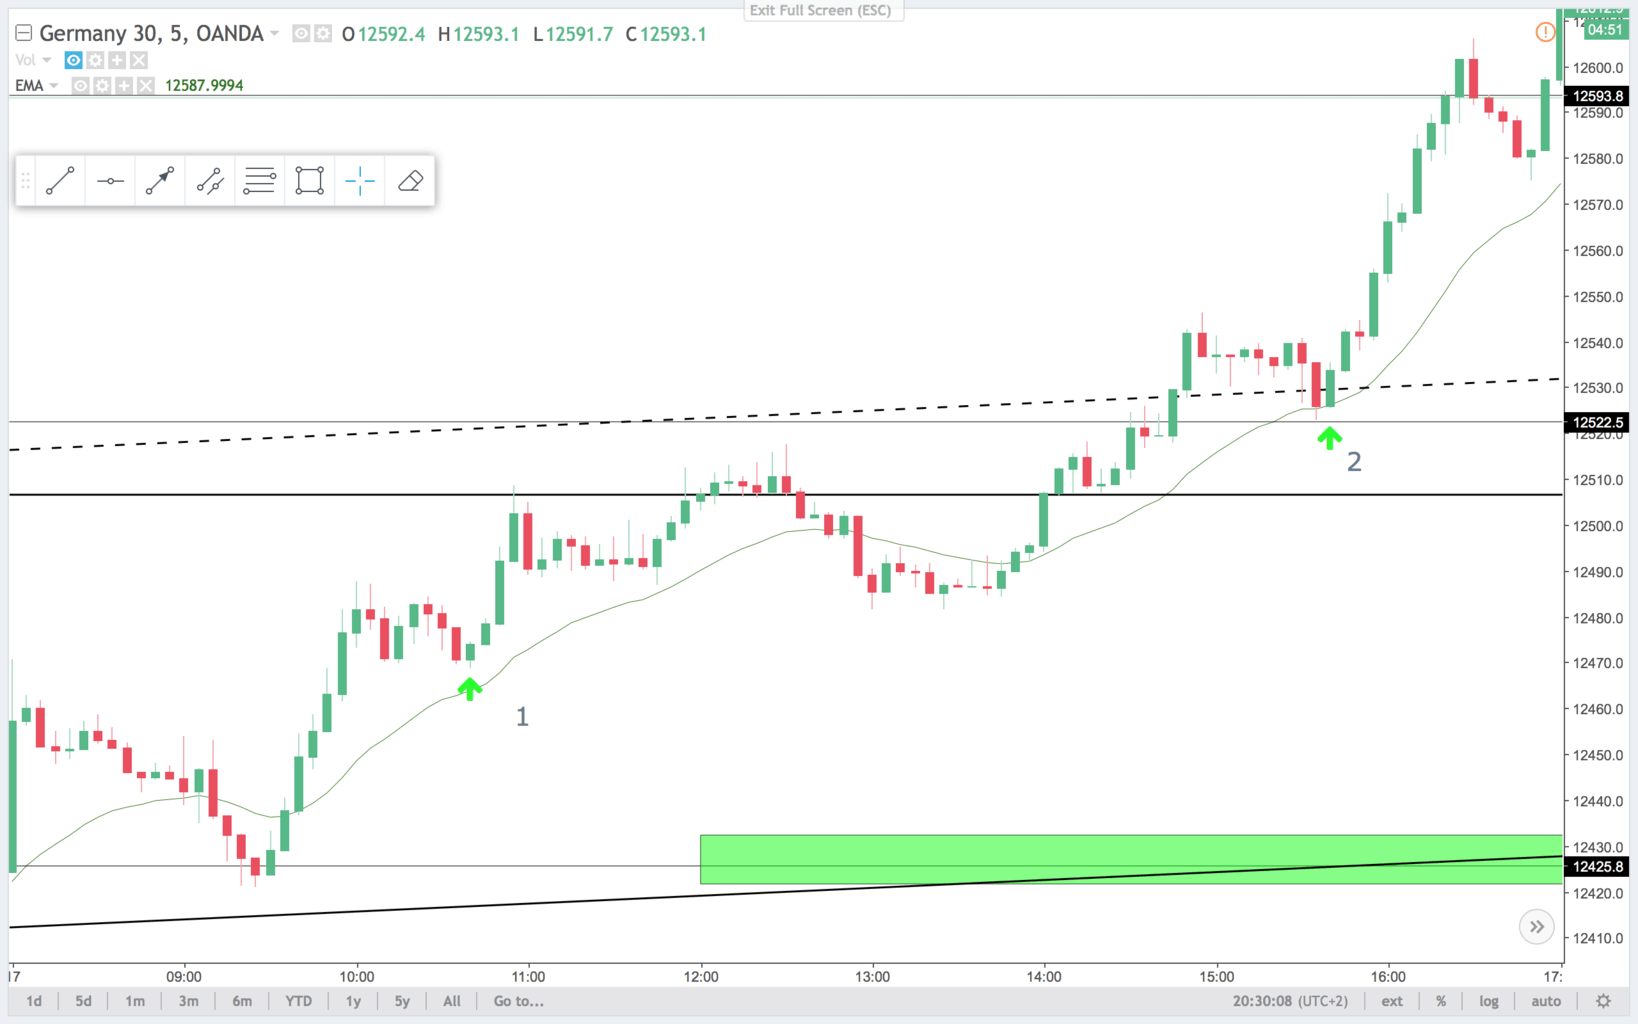
On the 5 min chart this is a beautiful two legged correction second entry long. Double bottom bull flag. Textbook setup for a long.
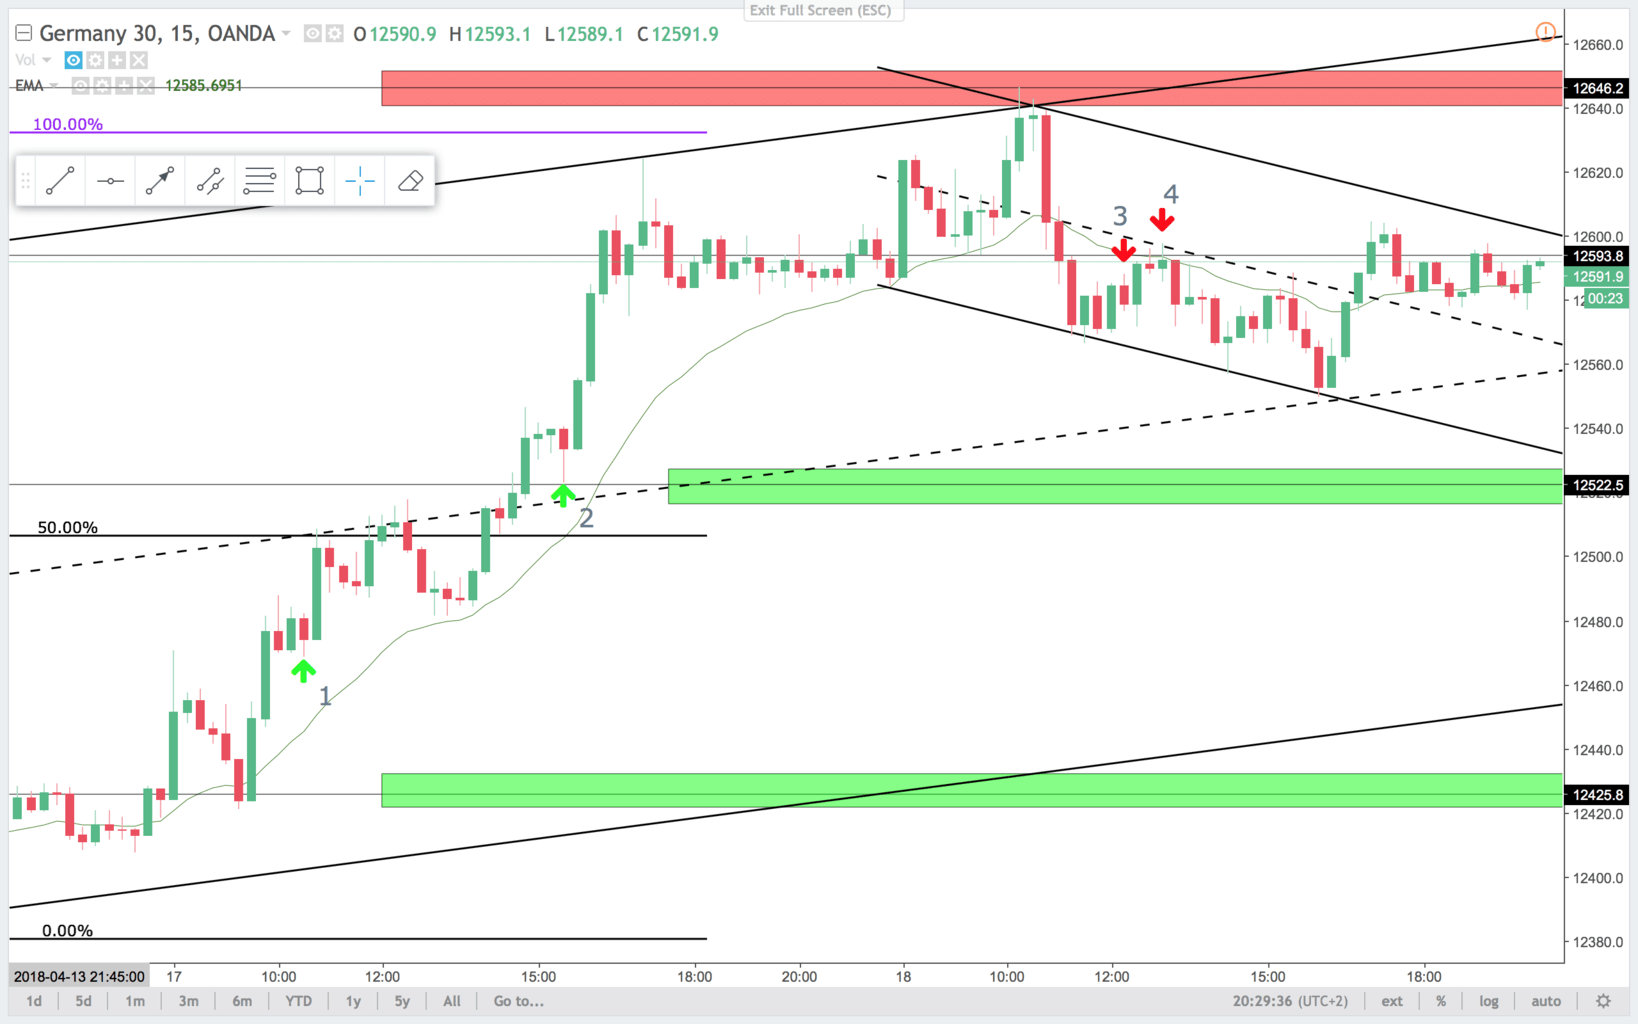
15 min chart:
5 min chart:
Trade 2:
On the 15 min chart it is a failed reversal attempt. Also a BOPBL (Break Out Pull Back Long) setup.
On the 5 min chart this is a bull flag, and a failed break lower. The signal bar is a inside bull bar. Price is always in long, and trending strongly, so you are just looking to get long. This is a good setup for that.
Trade 3:
This setup failed, but at wanted to share it with you to show you, that it is not all setups that succeed.
On the 15 min chart this is a small bear flag after a strong bear leg. You think that this is a strong enough leg to get a second leg. The signal bar is a small bear bar double top. Low risk trade. The entry bar is the next bar, it breaks lower first then higher. It is a first entry short on the 15 min chart.
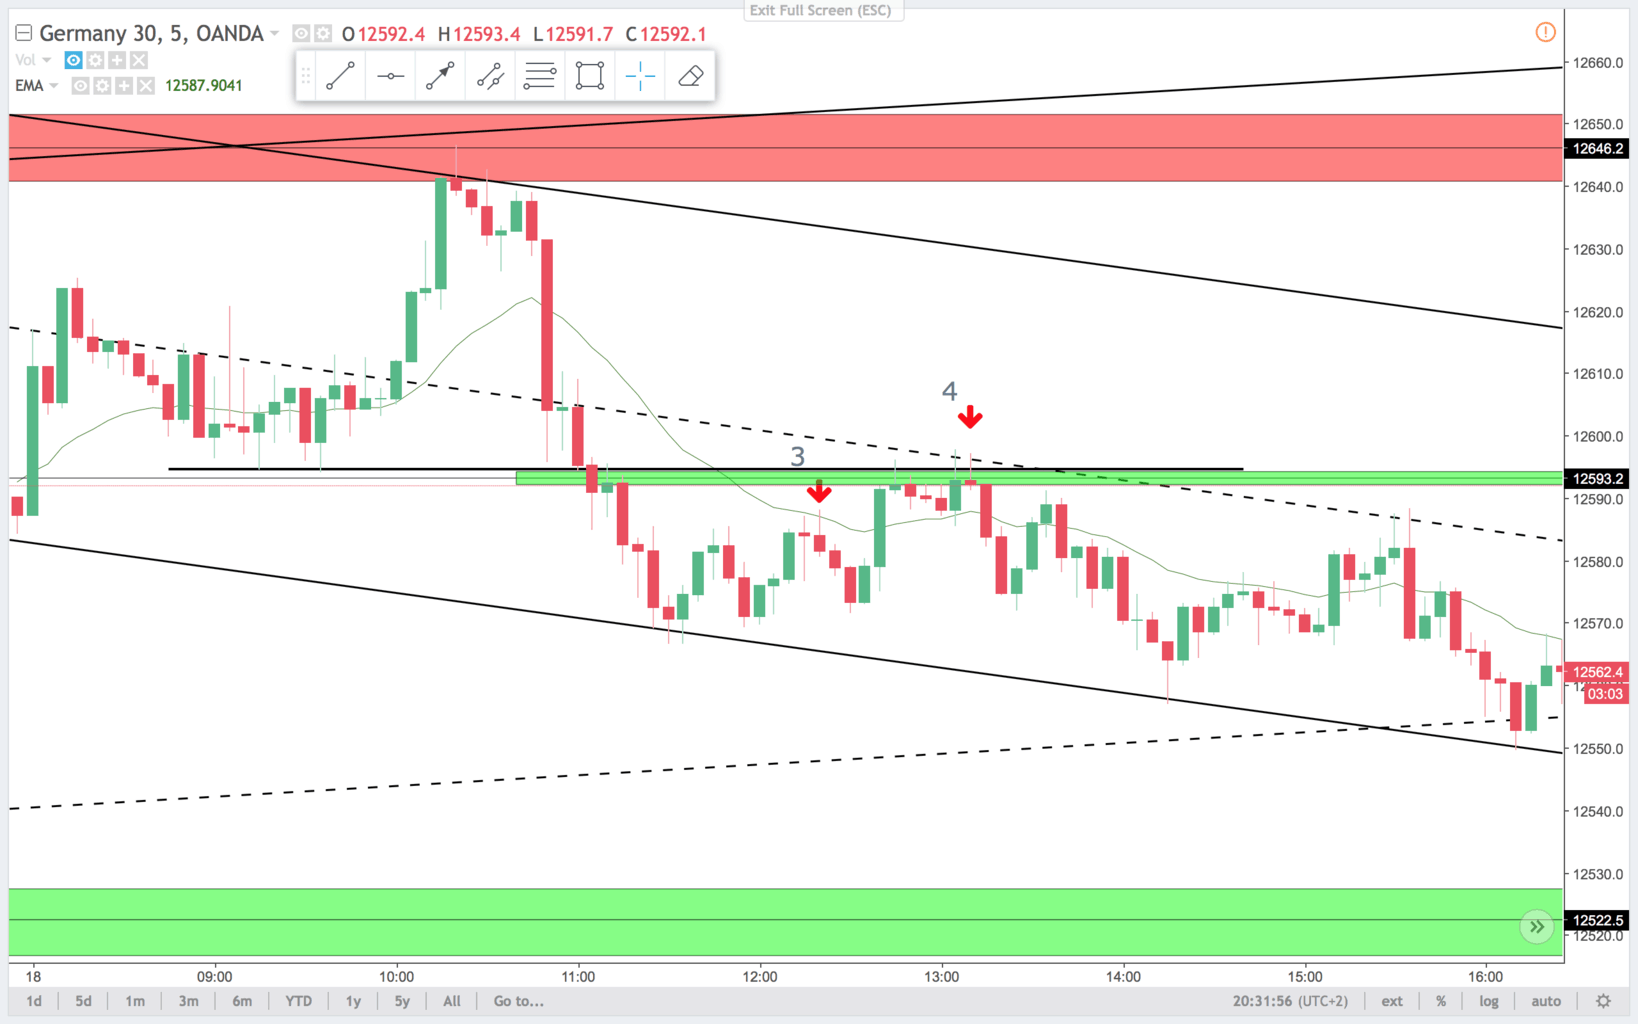
On the 5 min chart you get the same setup as trade 1, just a bear setup instead of a bull setup. This time the setup fails. If you were smart, you got out of this trade break even, but not enough movement for a 10 pip scalp. The context is still, a strong bear leg down, and probably a second leg down, so I would still look for shorts.
5 min chart:
Trade 4:
On the 15 min chart this is a nice trade. Second entry short failed reversal up. Strong bear leg going down. Overlapping bars and a weak correction(did not even correct 50%). The signal bar was the small bear doji-looking bar. It closed in the lower third, and that makes it a ok signal bar.
On the 5 min chart this is a double top bear flag. Second entry short and a small risk on the signal bar. You are still expecting a retest of bear strength. So i like to keep a runner on this trade. That would have been stopped out break even though.
Setups like the third trade can look good and be good but still fail. If you take these trades 100 times you would win more that you lose. That is the positive expectancy of price action setups. You have to accept, that there will be losers once in a while.
Have a nice trading week.
synes nok lige man som amatør hurtigt blir hæftet af, super ærgeligt
dem der forstår det, læser alligevel ikke med.
så måske en light udgave som mange flere ville få glæde af.
på forhånd tak
bedste hilsner
js
Hej Jean,
Undskyld det sene svar.
Vi er selvfølgelig kede af, hvis vi får hægtet nogen af i vores artikler og videoer.
Vi er netop nu ved at arbejde på et basis price action kursus efter sommerferien, til dem der gerne vil have noget af det mere basale på plads.
mvh
Hans-Henrik