When we teach daytrading around the country, fractals are always a constituent part of the curriculum.
Fractals help make it easier and more objective where to draw the trend lines, support and resistance levels, etc. Often, one of the criticisms of Technical Analysis is that it is too subjective. Or, in other words, it depends on the eye that looks. So if a daytrader believes that the market is going to rise, then you tend to notice the trend lines and indicators that tells you that the market is going to go up.
You can overcome this by working with fractals as support points. So let’s take a look at what creates a fractal point.
How is a fractal created?
A fractal point is the highest or lowest point within five bars on a chart.
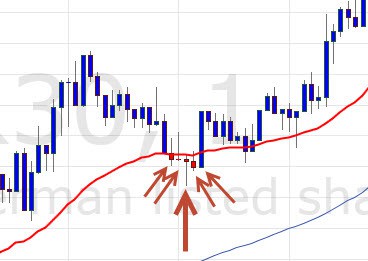
As you can see in the example below, we have a fractal low, where the two bars before and the two bars after both have a higher “low” on the bar. This makes the point a fractal point.
To form a fractal high, the opposite needs to be true, that is, the fractal point is the highest point within five bars, with two lower bars both before and after.
How du you use the fractal points?
There are many ways to make use of the fractal points. You can draw trend lines from point to point or you can use them as support and resistance areas.
Here you can watch a video with some of the methods that I use with the fractal points in my daily daytrading.
In the video, TradingView is used as we have made a number of video guides about. You can read more about EMA and moving averages in this article.
Do you have questions regarding daytrading with fractals?
If you have questions or comments about fractals, please write below.