By Claus Andersen
26. Juli 2019
240 min chart:
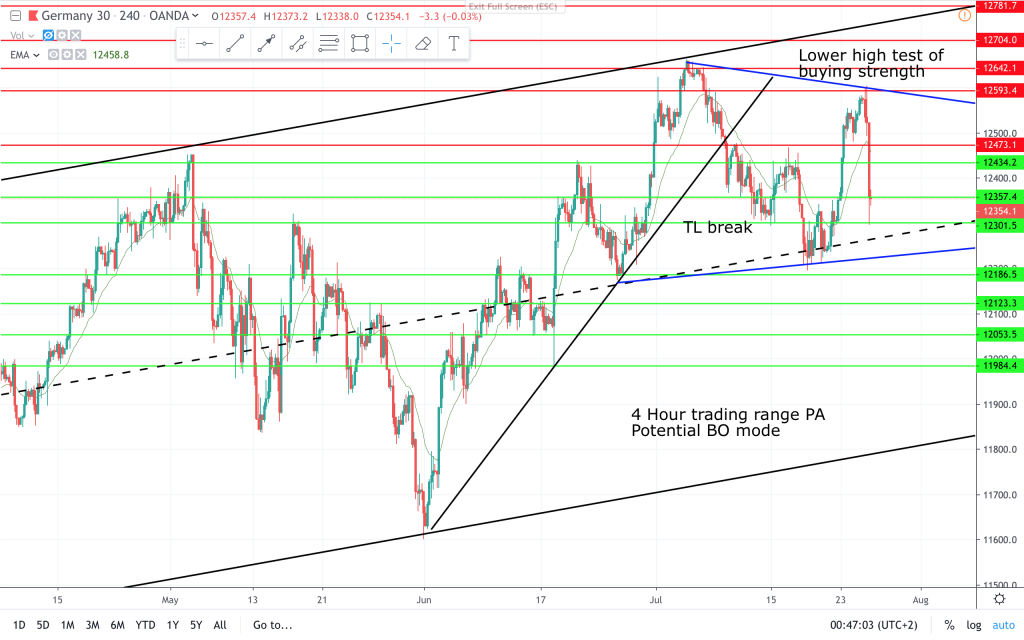
So there has been a development in the DAX. After hitting the bull channel line price pulled back to the midline of the bull channel. Now as expected price made a test of bull strength. Bears managed to make a lower high, and they are now trying for a lower low too. I think that for the near future the probability is that price will trade within the blue triangle. A congestion area. I will look to trade it like a range. When it breaks out, the probability is, that bull trendline will get tested.
15 min chart:
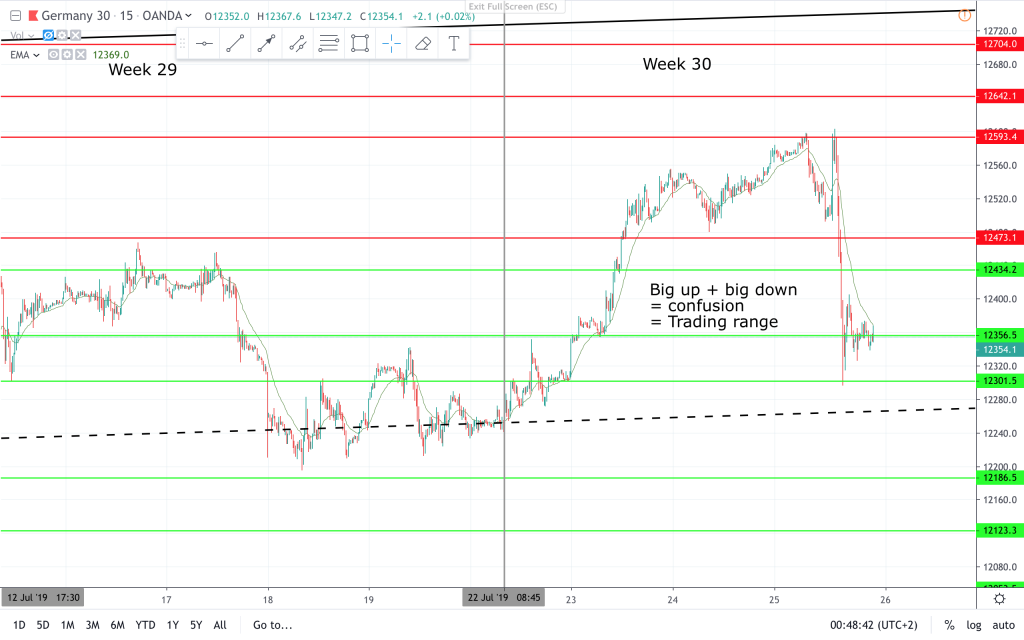
On the 15 min chart this week started with a strong bull push(spike), that turned into a channel. Then after a failed break higher double top price plunged. Now we had a big move up followed by a big move down. Probability is that this leads to confusion, and that is a hallmark of a trading range. That is one reason I think we will trade sideways for now.
60-70% that we will trade sideways, still means a 30-40% probability that price will break out. I am not ruling anything out, but will bet on the probability until it changes.
New support and resistance levels on these charts.
Have a nice trading week.
Claus Andersen