By Claus Andersen
10. Juli 2019
60 min chart:
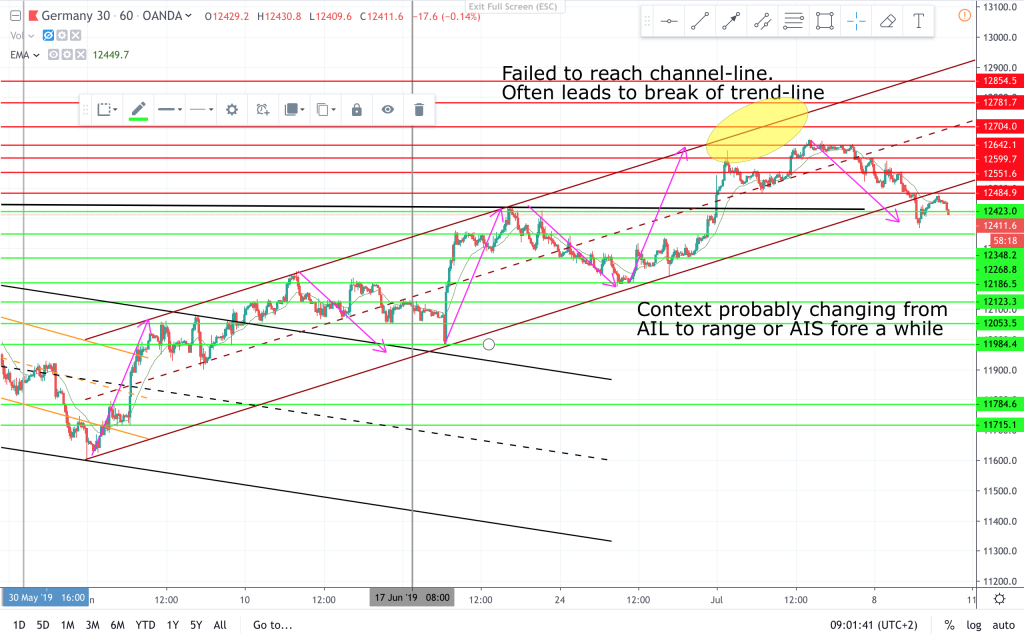
On the 60 min chart it’s clear that price moved up in a bull channel. Last week price missed the bull channel-line. That was a sign that bulls were losing momentum. This is not a sure reversal sign. Often it means sideways trading and another bull strength test. But it can also lead to a trading range or a reversal. On the 60 min chart the price is still AIL but in a correction. Wait for a reversal setup after a pullback before looking for a long.
15 min chart:
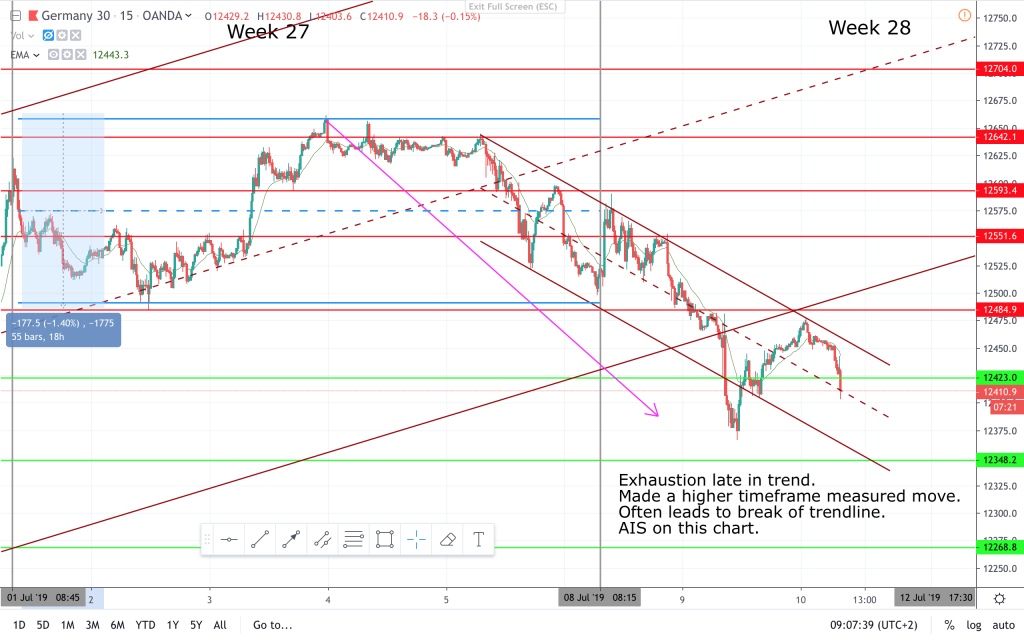
This chart is AIS which is opposite of the 60 min chart. Price was in a range(blue range) last week(27), and broke out the low of the range. Then pulled back the to test the low of the range from below. A classic breakout pullback sell pattern. After the exhaustion and break of the channel-line price often tests selling strength or the low again. and that is what I’m looking for, and how price reacts when testing lower.
New support and resistance levels on the charts.
Trading is a long journey. I have been at it for a long time, and still make mistakes. The definition of insanity is doing the same thing over and over expecting a different result. That means that if you lose over and over again, then you need to change something in your trading. Just a little food for thought.
Have a nice trading week.
Claus Andersen