By Claus Andersen
3. September 2019

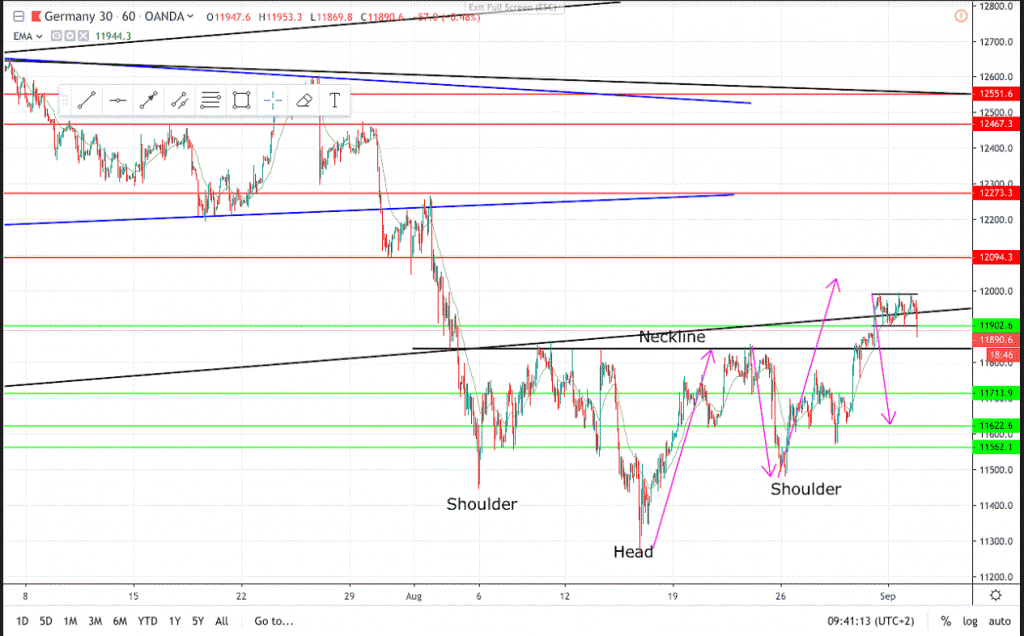
Price action pattern in the DAX 60 min chart has triggered. It is a head and shoulders reversal pattern. Often after a break of the neckline the pullback goes to test the neckline from the opposite side. In this case as new support. Remember that the neckline is a support and resistance area and price does not have to go all the way to the line to test the area. Also a measured move correction would take price back into the head and shoulders pattern. In that case the pattern looks more like a two leg bear flag pattern. We will have to wait and see. For now be aware of the context in the pullback.

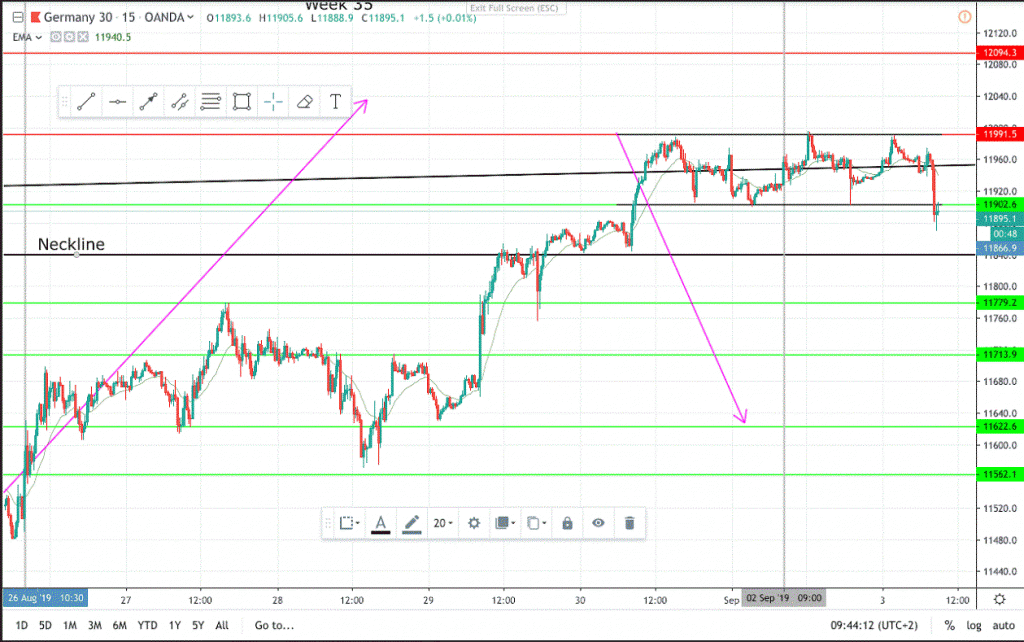
On the 15 min chart above we see that last week was a strong bull trend week. The week opened on the low and formed a trading range. It broke to the upside on Wednesday. Friday and into this week price traded sideways in a trading range again. The BO was strong, but the trading range has gone on for long, and the BO probability direction is near 50:50. Look for a BOPB or a FBO.
New support and resistance levels.
Have a nice trading week.
Claus Andersen