I always use multiple timeframes in my trading and analysis of the market. I use the weekly and daily chart to give me an indication of the overall direction of (if there is one) and I then use simple patterns to form a bias for the direction and for targets for my trades.
In this article, I will go trough one of the patterns that I use. In addition to the pattern I will also provide you with some statistics on the pattern, which many traders don’t either have, or want to provide when they write about a specific pattern. But I feel that it should be presented whenever it is possible.
The pattern is a very simple candlestick, it is a “Lower Low, Higher Close” (LLHC), and the opposite; “Higher High, Lower Close” (HHLC). It is a very simple pattern, and as the name suggests, in the bullish version it is a candlestick which has a lower low than the previous candle and a higher close. This gives an indication, that there is a short-term reversal going on. However, it must not have broken the previous high, as there then would not be a target to aim for.
When I first noticed this pattern I thought it was quite interesting, but I didn’t begin to implement it in my trading before I had tested on multiple timeframes and markets and several years of data.
In the video you can see the results, but most pairs has about a 50% winrate with the target being hit first day. Of course it’s a great strike-rate, but when we go down to a lower timeframe on the hourly / 15min then it can give some really good Risk:Reward trades. It might also be that you can get a higher strike-rate by adding a filter, which could be above/below a moving average.
I have drawn the pattern below.
LLHC
Here is the bullish version.
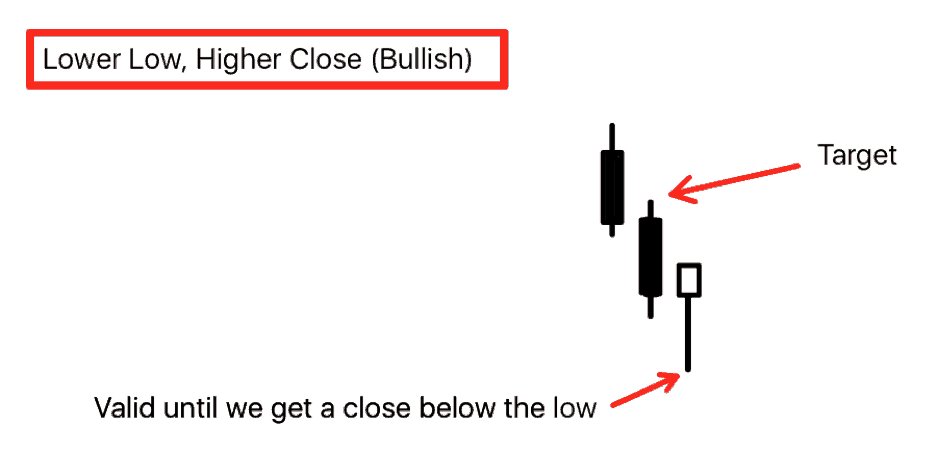
As you can see on the illustration, the pattern is (in my opinion) valid until we get a close below the LLHC candlestick. Target is the high of the previous candlestick. In my study, I have limited the days that the market can hit target to three. After the three days I am not interested, but it is worth to note that we do sometimes hit the target on the forth or even the fifth day. Although this is very rare.
HHLC
Here is the bearish version.
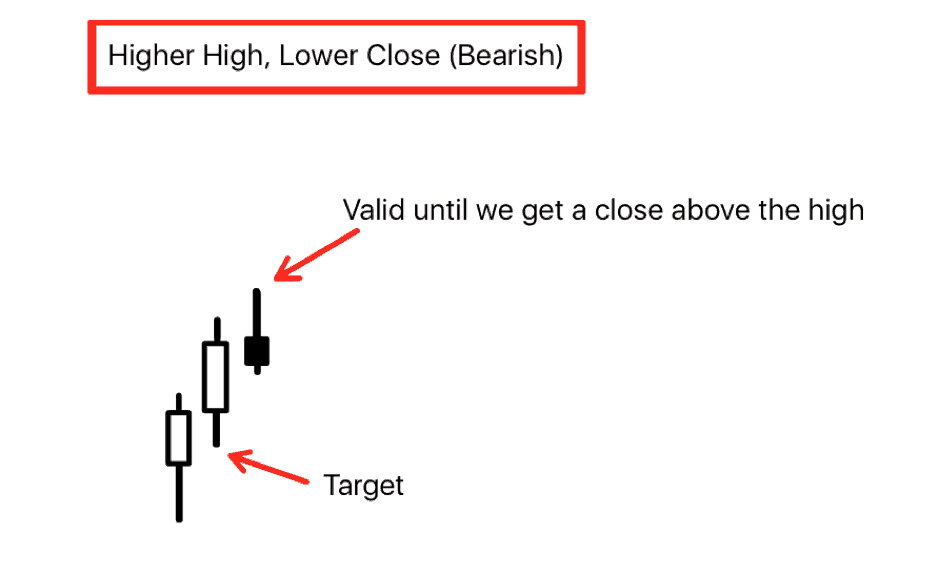
The rules for target and “stop” are the same as above.
Video
Here is a video of the pattern and a more detailed overview of the statistics on the pattern.
Statistics
In the video you also get an insight into how I backtest. By using excel and not doing it manually, I avoid (and save a lot of time) some of the mistakes we as human makes. I have tested this pattern on both the daily and weekly timeframe. I put emphasis on the daily timeframe, because a lot can happen on a week in relation to intraday trading. But let’s take EURUSD as an example.
On EURUSD I have gathered the following statistics since 2009.
HHLC:
| Day1 TP | 48,23% |
| Day2 TP | 58,87% |
| Day3 TP | 63,12% |
LLHC:
| Day1 TP | 53,47% |
| Day2 TP | 63,89% |
| Day3 TP | 68,75% |
As you can see, the odds for hitting target rises on day two and three, as it is not always the case that we hit the target on day one.
I think you best exploit the pattern with a breakout strategy, like Hans Henrik’s 5/1 method.
The purpose of this article was to give you some inspiration with the pattern, so you can test it for yourself and maybe play around with some filters, but also to give some insight into how I backtest (as can be seen in the video). In a later article I will go more in depth with the backtesting process.
Remember, you always need to do your own studies so you have the right numbers. I have often seen that most of the conventional the classical trading books are not correct.
Questions?
If you have any questions, just post them below.
Hi Gustav,
Interesting. Where do you put your Stop Loss in this strategy?
Hi Sam.
This is not a system in and of itself, it is just a bias for my short term trading (H1, 15min). It might work with a trend filter for stock indices with a long-only approach (most systems does lol).