These days all I hear about is Bitcoins and crypto currencies, and I can see why. Not since the happy days of the dot-com bubble have we seen an Investment vehichle increase its value so quickly as Bitcoins does these day. When the tech stocks went up in the late 90’s they where also called the “new weird stuff” that no one really understood. The internet was fairly new and 80-90% of all the new tech gadget we have today were not even thougt of at the time.
Those of you remembering the time up to the crash in 2000 – 2001 may remember being puzzled about whether you should join this crazy ride or not. Some predicted an eternal rise in stock prices and we heard people say thing like:
“This time it’s different” and “There will always be an increasing demand for tech stocks”
History shows us that the tech bubble couldn’t last forever and the stocks that survived the crash usually fell down with 80-95% and it took several years to recoup to old Price Highs. Many new Bitcoin owners today had just been born in the late 90’s and today they don’t have a memory of how it feels to see a market crash with 50% or an entire industry crash with 80-90%
That made me Wonder how good an Investment the crypto currencies actually are when we compare to the risk we take in these new papers. So let’s take a look into some basic theory about measuring risk.
Sharpe ratio
One of the most widely used tools for measuring Investment risk is the so called Sharpe Ratio. This is basically a formula that compares the return on a paper or in a portfolio with the risk you take while being invested.
The formula was developed by William F. Shape and it looks like this:
(Expected return on a portfolio – risk free rate) / Volatility of the portfolio measured in standard deviations.
What this formula does is, that it takes the expected return of a portfolio and divide it by the statistically expected volatility of the portfolio.
But why do I bring up this old and dusty formula into the middle of this wonderful and World wide wealth creating crypto frenzy? Well I thought it could be fun to see how good an Investment crypto currencies actually is compared to the “good old fashion” stock or currency portfolio. Because right now stock- and currency traders (like my self) are viewed upon like old outdated dinosaurs that has yet to see the light of the crypto miracle.
And yes, I might be a dinosaur, but let’s see how the cryptos are doing when measured with conventional risk tools.
Sharpe ratio and crypto
Here we see a chart of different markets and their Sharpe Ratios
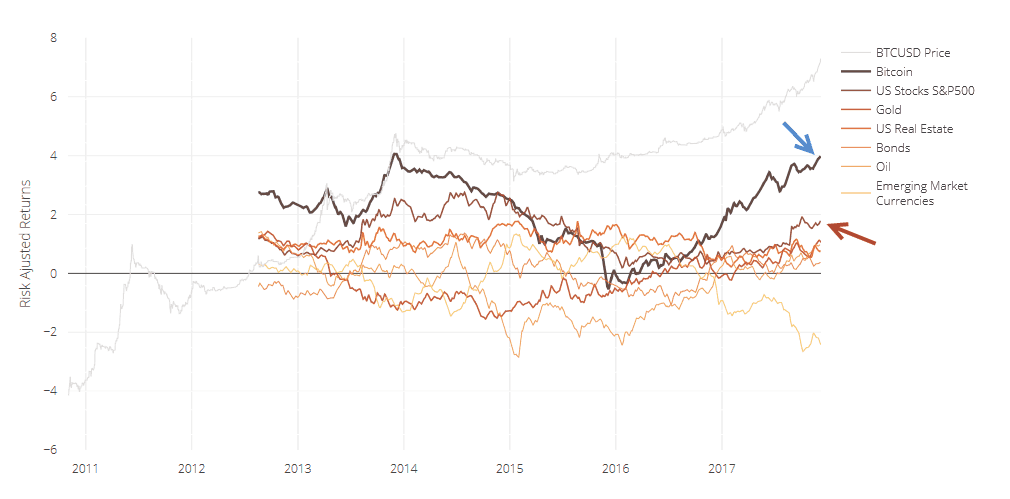
Here we see a lot of different lines. But the two most important are “Bitcoin” (Blue arrow) and SP500 (red arrow). The reason that I don’t Count in the light grey Bitcoin line on the top is that this is BTC measured in USD. And since USD has fallen in value lately toward EUR then I chose the Bitcoin Price with out the USD factored in. Remember that if you are a European buying BTC in USD and the BTC doubles in Price while USD is cut in half then you end up where you started.
In the graph above we see that Bitcoin has been about twice as good as SP500 in creating return when we factor in risk/volatility.
But we need to consider another aspect as well. Because what if you where to chose a crypto currency right now to Invest in? How would you now which currency would be the Winner in the future? If I buy an ETF for SP500 it covers 500 different Companies and I have my portfolio Diversified automatically. If I where to do the same thing in crypto currencies I would have to buy a number of different products. So let’s look at the Sharpe ratio for the most commonly used cryptos right now.
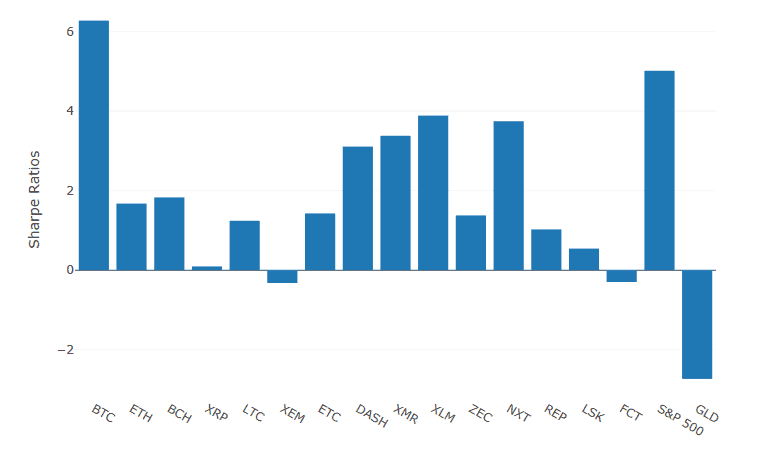
In the chart here we see that the Sharpe Ratio for SP500 is quite a lot higher. This can be caused by chosing different times and dates for the Sharpe Measurement. But we can easily compare SP500 to the other crypto currencies here. And what we see is that Bitcoin is still beating SP500. But in this case SP500 is actually a lot better Investment compared to the other minor cryptos. But how can this be? These cryto currencies have risen several hundred percent, a lot more than SP500. But here you have to remember that we use volatility in the Sharpe Ratio. So let’s take a look at the volatility for these markets.
Volatility and crypto currencies
As I mentioned above the volatility is an important factor when calculating the Sharpe ratio. Here we can see the volatility for the most common cryptos and for SP500.
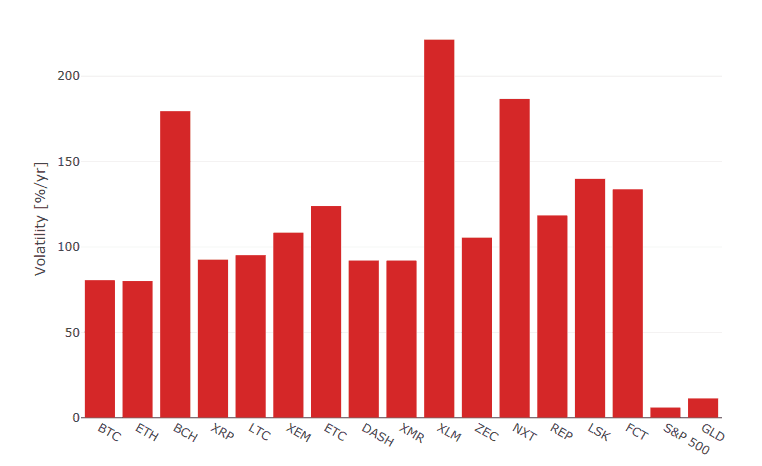
(Source: Sifrdata)
It’s clear to see here how much more volatile these crypto currencies are compared to SP500. So if I wanted to take the same risk in a SP500 Investment as I do in a crypto Investment then I could just leverage my SP500 via CFD’s or futures by a factor of 15 – 50 to get the same risk exposure. And then the return is not that far apart anymore.
Sortino ratio – the negative risk
In the cases above we could see that the Sharpe ratio for different cryptos are not that diffent from SP500. But when we calculate the Sharpe ratio we use the over all volatility/standard deviation. This volatility can be both positive and negative in Price movement. To get a better Picture of the negative risk, which often is of most interest to os, we can use the so called Sortino ratio instead.
Here we take the return of the paper minus the risk free rate, but this time we divide only by the negative volatility. When doing this we get graph
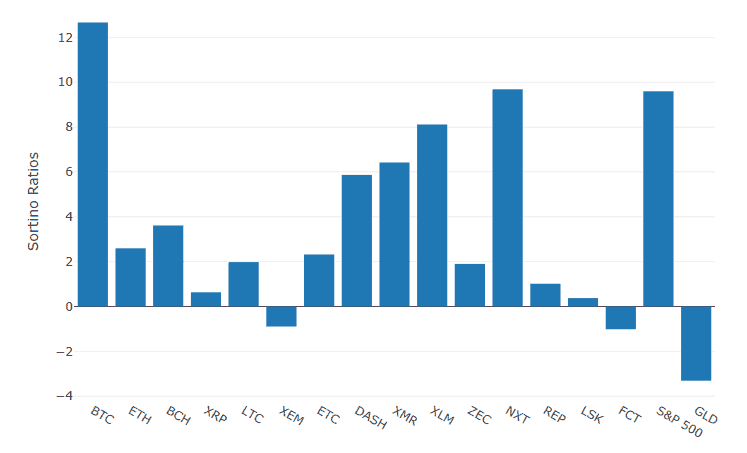
(source: sifrdata)
Here we can see that Bitcoin (and NXT) is still a bit better than SP500. But we can also see that all the other cryptos are far below SP500 when we only compare return to negative volatility in the papers.
Conclusion
I’m fully aware that the average Bitcoin investor hasn’t got much interest in these numbers. Most crypto investors today are buying in on a “lottery ticket” well knowing that the Price can go to zero or to 100.000. And that is perfectly alright with me. But when Bitcoins are said to be the only great Investment these days and people are selling their stocks and houses to buy Bitcoins then it tells me that they have no real grasp of the basic theory regarding return versus risk. Beacuse if you use these risk Measurement tools we can see that most cryptos are doing worse than the normal stock market.