
In this article, we examine the topic Inside Bars and look at how and when to trade profitably.
In addition, we review the following:
- The use of indicators as a filter to trade,
- Ideas to back-test strategies to increase profitability
- The use of Inside Bars as bias on the higher time frames,
- Inside Bar Failure – an exploitation of the daytrackers caught on the wrong side of the market.
The article and strategy are based on DAX on a 5-minute graph. The strategy should work on other markets and time frames, but that’s not something I’ve personally traded and tested.
What is an Inside Bar?
An Inside Bar is a candlestick that is within the frame of the last candlestick. 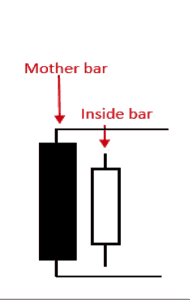
In the example to the right, we can see a so-called Mother Bar and then an Inside Bar, which is within the frame of the Mother Bar.
The Inside Bar symbolizes disagreement among market participants about the direction the market should move. When an Inside Bar breaks, it often happens that a trend continues in the direction it breaks.
However, there are several things to pay special attention to if you want to trade based on Inside Bars.
Criteria for trading Inside Bars
Before we look at the entry, stop and target, we have to look at where and when we want to see our Inside Bars. As with most other strategies, you will not be successful if you trade each setup without any well-defined criteria and filters. Inside Bars must be taken in context – and it may be worth being a bit picky and patient.
We list some criteria below so we will not trade every single Inside Bar, as it’s likely not to be profitable.
Trading strategies should always be seen in market context
It is true for almost all strategies that they work really well under some conditions – and less well under other conditions. I would categorize Inside Bars as a momentum strategy that follows the trend.
Therefore, we will not trade Inside Bars in a consolidating market as in the example below. It is DAX on a 5-minute graph. Here you will typically get stopped out frequently as market participants cannot really agree on the direction of the markedet so the market fluctuates much back and forth.
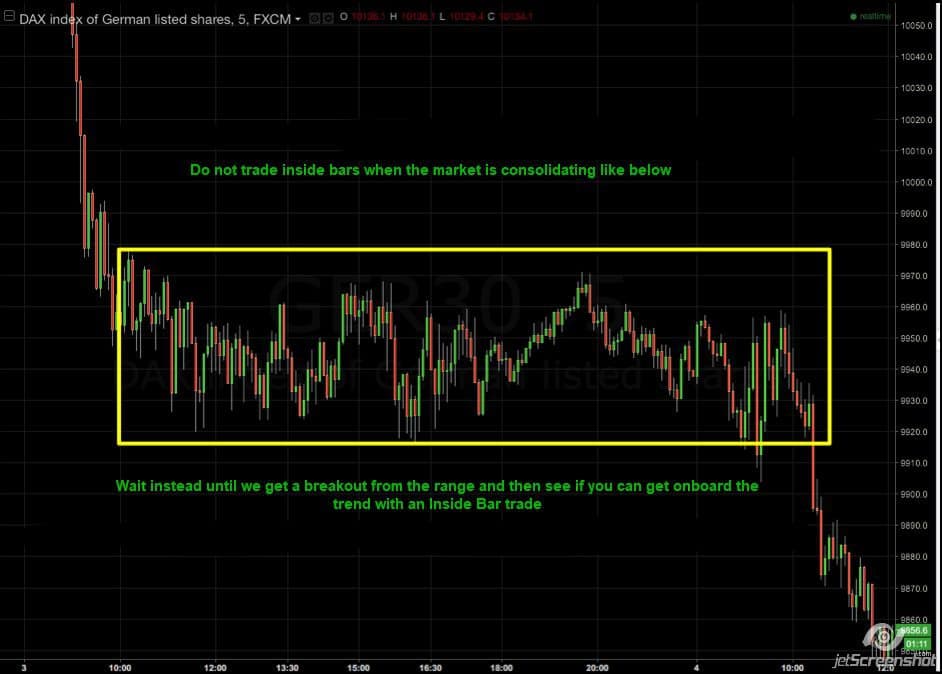
In such a case, one must be patient and wait until the market is broken out of the consolidation zone and again begins to show a trend. First of all, you must start looking for opportunities to jump on the trend of an Inside Bar. We must, therefore, be sure that the market is changing and not only in a trading range, so it trades back and forth within a given range.
21EMA – Exponentially moving average
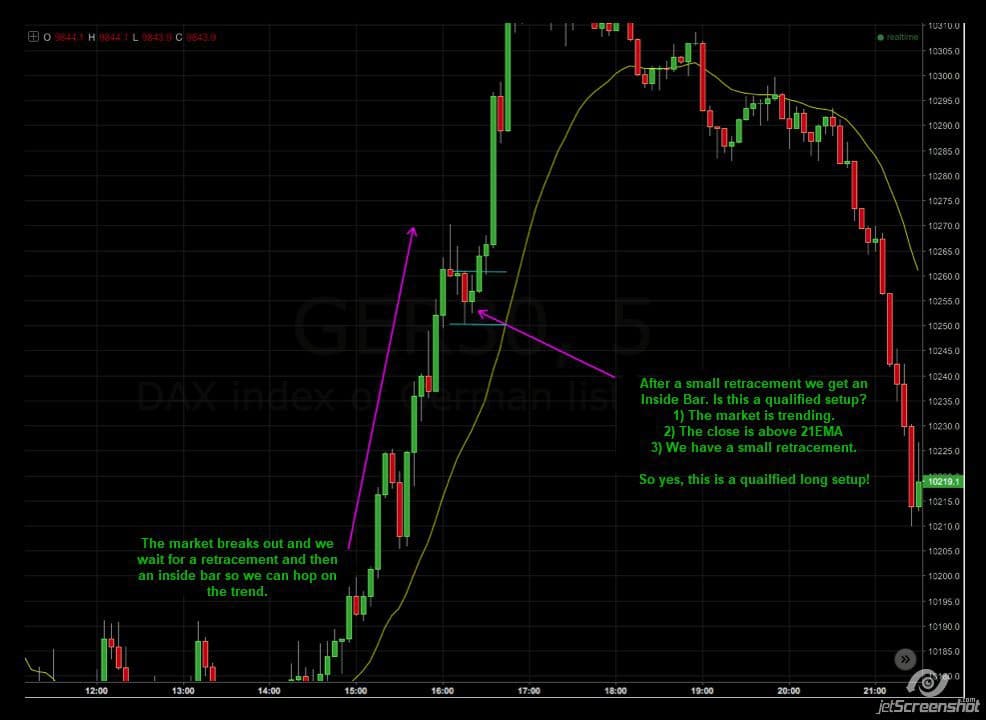
The next criterion for the strategy is that we can only go long if the price is above the 21-point exponential moving averages. Conversely, we can only go short if the price is below 21 EMA. 21 EMA thus acts as a sort of filter for the trades.
It is a trend-following strategy, thus ensuring that we are not going to trade against the trend.

Some daytraders have a rule that either the Mother Bar and/or the Inside Bar should not touch 21EMA, but I have not personally had that rule. I have often seen the market testing 21EMA – then continuing the trend. But try experimenting with it in backtests and get your own experiences with what works best. I know Hans-Henrik Nielsen has a rule that he does not trade when the bar touches 21EMA, but you can try this out and see what works best.
There must be a retracement
The last criterion for the strategy is that we need to see a retracement in the market before wbuy/sell/ sell. When we get a breakout of a consolidation area – or a new move up or down – we should wait for the price to move a bit back before we can trade.
Entry, stop-loss, and exit strategies
Now that we have defined where and when we want to see an Inside Bar, let’s take a closer look at how we get in and out of the trades.
Entry strategies
There are two techniques that you can use for entry. I use method no. 2.
1) The conservative strategy
The conservative way of committing entry is to wait until the last swing-low / high is broken.

Some daytraders claim that they get a higher win rate by this technique. Personally, I think that you get in very late and that in the long run, it doesn’t pay to wait.
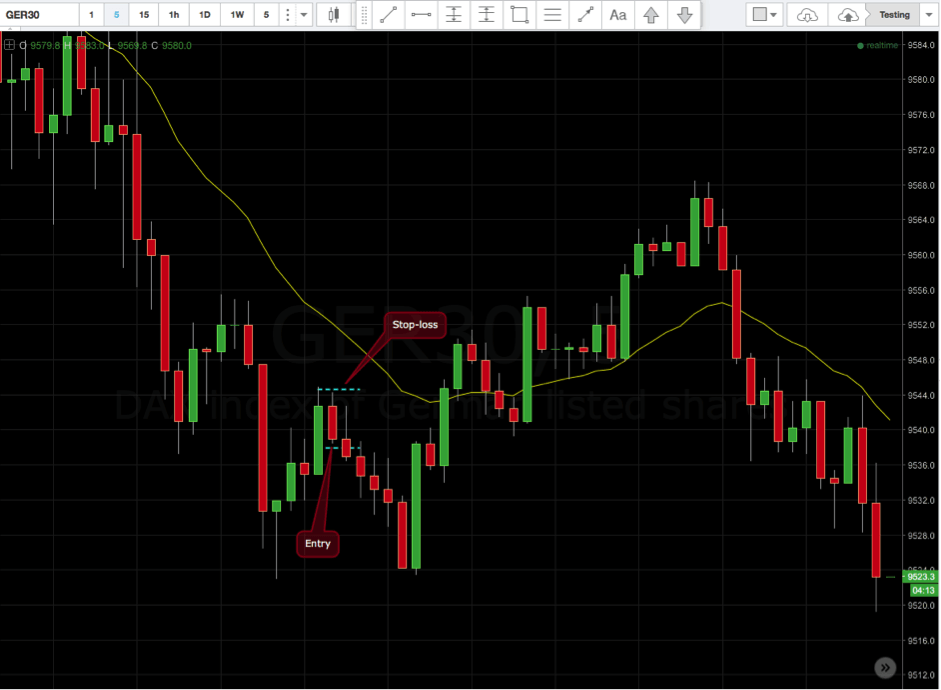
2) Enter on the break of the Inside Bar
This is the slightly more aggressive approach. Here you go short immediately when the price breaks the Inside Bar low.
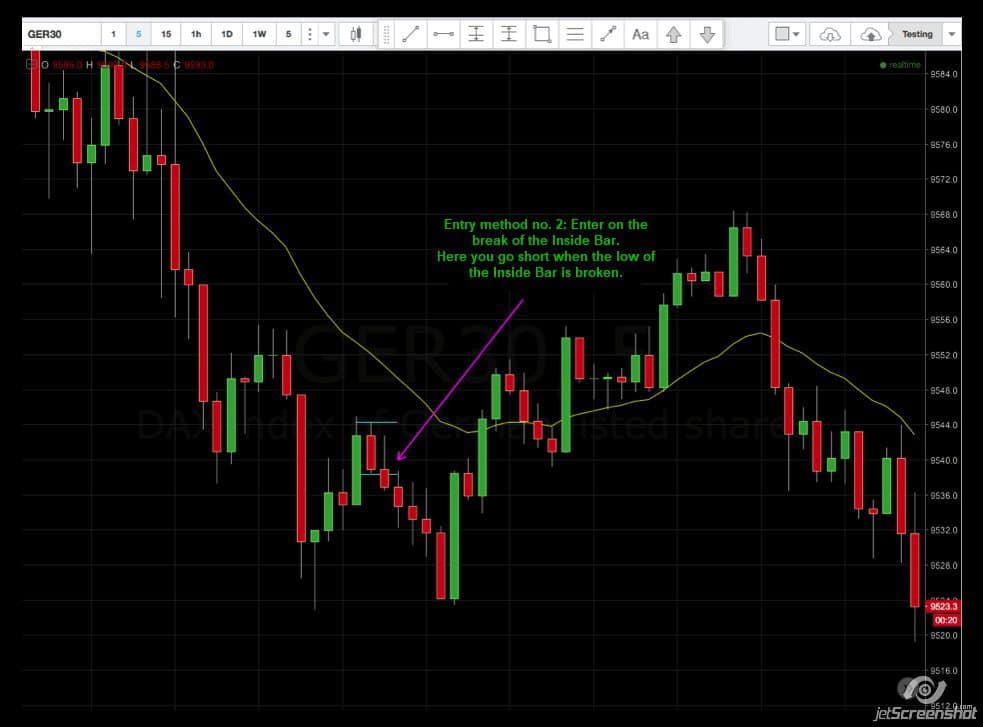
Here is the advantage that you get in at the start of the move and thereby get a good risk-reward ratio. One’s win-rate may not be as high – as with the conservative method – but I think it’s more profitable as you get a higher R.
How to set the stop-loss correctly
Above we defined how we get into the trade. Let’s look at when we should step out if the market is moving in the wrong direction. You may want to read our article about setting a stop-loss correctly.
I recommend using a stop-loss 1-2 ticks above/below the Inside Bar (dependent of the direction you trade). That’s what I use in my daytrading. However, if you use the conservative entry method, I would instead recommend a tighter stop-loss (possibly 1-2 ticks over the bar that break the swing point), otherwise, you will have too wide of a stop-loss.
How to define your exit and target
Finally, we need to decide when we to exit the trade.
Here are several options:
- You can have a fixed target measured either in number of points or measured in R.
- You can trade with a trailing stop-loss and different methods for this.
- You can use Fibonacci Extension Targets and measured moves.
Fixed targets measured in R are better than measured in points
If you want to use a fixed target, you should definitely have done a thorough job in backtesting different sizes. I would recommend measuring it in R, and not in number of points, since R is not affected by volatility. This means that you will not have a target of 30 points on a day where the market fluctuates with 10-15 points of movement. Conversely, you do not take a 10 point target in situations where the market fluctuates by 40-50 points.
Read the article on risk management with R.
Trailing stop-loss
When trailing the stop-loss you can sometimes catch a few long trends and big fluctuations in the market, which you will not catch if you trade with fixed targets. The advantage is that sometimes you will get really big winners. The downside is the reverse that you will experience a lot of small losers as well as winners who do not really earn anything worth mentioning.
A trailing stop-loss can be in the form of average trading range, a close above/below EMA 10. Or you can move the stop-loss down or up after a number of candlesticks in the trade direction. I’ve personally been successful in using a combination of a fixed target and a trailing stop-loss. The fixed target will then typically be a little optimistic, and will not be hit every time. But when you hit it, it will be a big winner.
I trail my stop-loss respectively below or above each candlestick, which is formed after I commit entry.
See the following example for further explanation.

Inside Bars on higher timeframes
I have personally gone away from trading Inside Bars in my daytrading, as I use some other strategies now. But I would say that it is a very good method for new daytraders, as it is relatively simple to perform.
I use Inside Bars on the higher time frames – hourly and daily graphs – as bias for my daytrading. For example, if there is an Inside Bar on the daily chart for next day’s daytrading, I’ll mark its high and low on my 5-minute graph. If a trade occurs then I will try to aim for a slightly bigger target than usual, as a breakout will typically occur when the price breaks an Inside Bar.
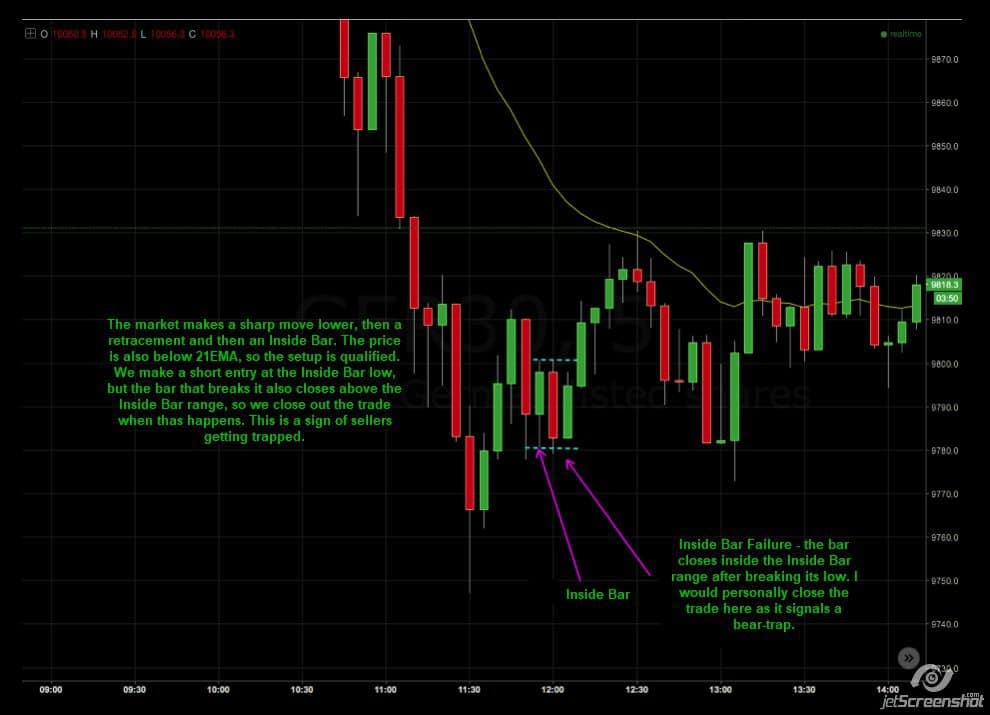
Inside Bar Failure
You can also turn the strategy on its head and try to take advantage of trapped daytraders when a breakout of an Inside Bar occurs. I have not used it myself in daytrading, but I know some daytraders are doing them on 5-minute graphs successfully.
I use Inside Bar Failure as a bias in my daytrading and swingtrading, that is, I’m looking for it on the higher timeframes.
I also use Inside Bar Failure to get out of trades quickly. An Inside Bar Failure occurs if the Inside Bar is broken and the price then closes within the Inside Bar’s range. If that happens, I’ll close the trade right away, as it often happens that the price turns around so you get stopped out.
Over time, you can minimize losers by using such techniques, so you can save some points and thus become more profitable in your daytrading.
See the picture below for further explanation.
Tips for the Inside Bar strategy
I highly recommend Tradingview for backtesting this strategy, as there is an indicator that marks Inside Bars automatically (though, it’s a good idea to get your eyes trained to spot them without help). The indicator is called jc_inside_bar and can be found under indicators if you search for “inside”.
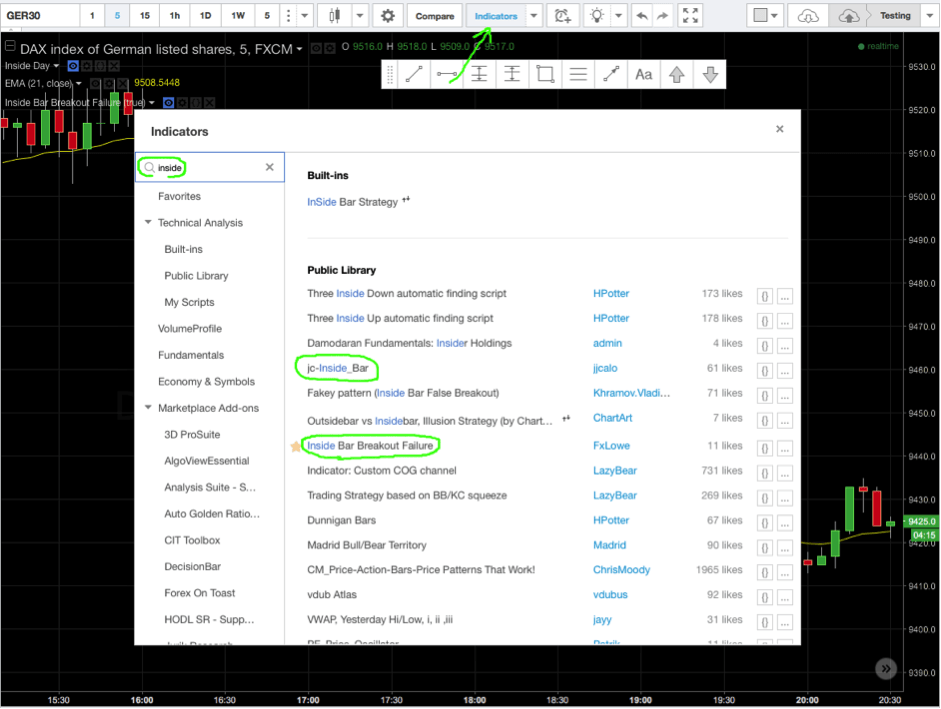
There is also an indicator that shows Inside Bar Failure.
Backtest Inside Bars
As I said, I would recommend backtesting different targets and trailing stop-losses.
It may also be a good idea to test whether the color of the Inside Bar has an effect on multiple trades. For example, only enter short if the Inside Bar is red and only long if the Inside Bar is green. Or you can advantageously backtest if the Inside Bar occurs at a particular Fibonacci ratio.
There are many ways to play with the strategy as well as ways to customize it to your own style.
Video
Below is a video that elaborates on the article and comes with several examples.
Hej,
Tak for jeres gode artikler.
Trader du inside bar/break 5m-TF i samme retning som trenden i højere TimeFrames t.ex 1h, 4h og D.
Hej Peter,
Jeg handler ikke inside bar så meget mere. Men ja, jeg vil helt klart skele til højere time frames. Det giver lidt færre men til gengæld meget bedre handler.