I am often asked what methods and indicators I use in my daytrading. I will share one of these simple strategies with you here. It is a simple trend-following strategy, which I have good experience with primarily on the Forex markets.
The example below is from EURUSD, where I took a short trade on February 7, 2017 in the evening.
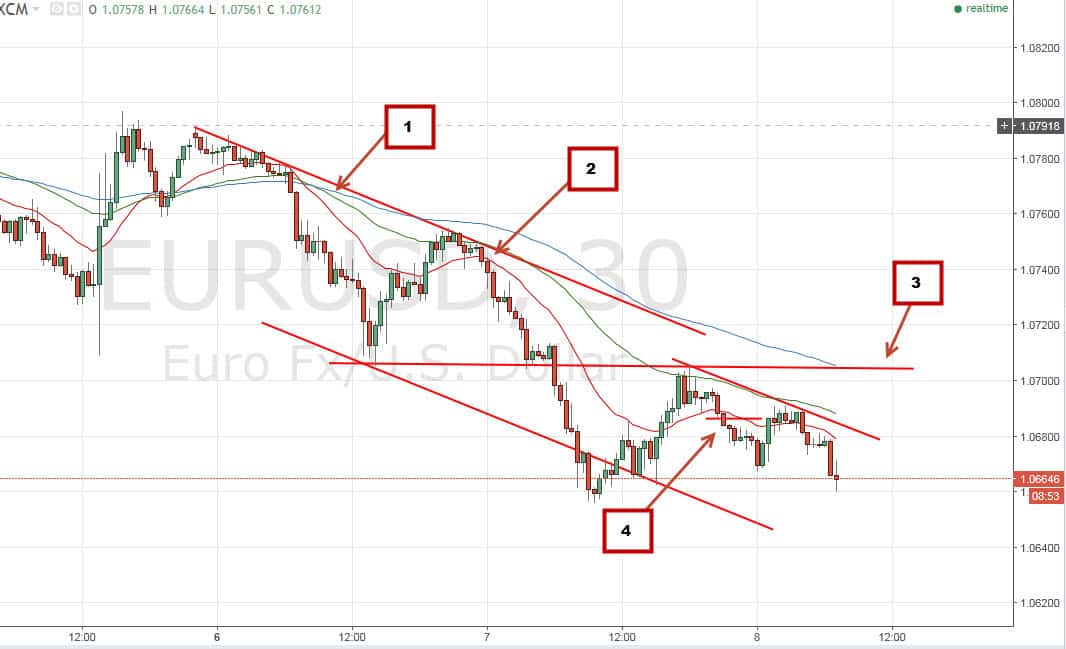
As you can see at the beginning of the chart (the 05.02 and 06.02) the price action on this chart was quite messy. The moving averages were on top of each other and there was no clear direction. Here, 100 EMA, 50 EMA and 20 EMA are used as the three moving averages.
At arrow 1, the three moving averages crossed down and lay in the right order with the fastest at the bottom and the slowest at the top. However, this is not enough for me to trust the trend. At arrow 2, the price rises and tests the moving average the first time and is sent down again. Now I trust the trend and can see lower highs and lower lows on my chart.
Next time the price comes up and tests my moving average, I’m ready for a trade. As you can see (at arrow 3), this test aligns with the moving averages as we test previous support, making the setup even stronger. As the price breaks down through the lowest moving average (arrow 4), I go short.
My stop-loss is set just above the line of resistance (at arrow 3). Over the night, EURUSD ran a little up and down, but has now begun to fall. At the time of writing, my stop-loss has been reduced over the latest peak, so I only risk a few pips on the trade. I am currently up with approximately 1.2 R, but a lot can happen still.
I hope the above makes sense. I will try to give more examples of this kind of trades in the coming period.