As many of you know I write a 50 page market analysis every weekend to prepare for the week. I have had a lot of questions about how I use this analysis in my daily trading so I decided to use a trade of mine from yesterday to show my every day trading process and routines.
Check the news
Of course it’s always import to keep track of the daily financial news flow. And on this day the news looked like this:
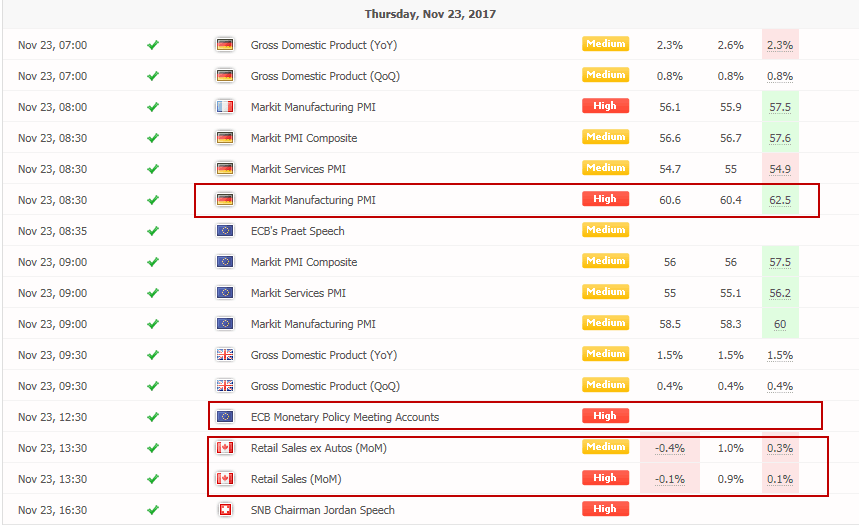
This screen dump where made after the news came out and therefore the numbers are filled in. But every morning I mark which news events have interested for me depending on which Forex pairs and trading ideas I’m looking at for the day. As you can se I had EURCAD as an interesting pair this day and therefore I was interested in news from Europe and Canada. But if some majer news where to come out from USA (job numbers etc.) that would also have been of interest.
Currency indicies
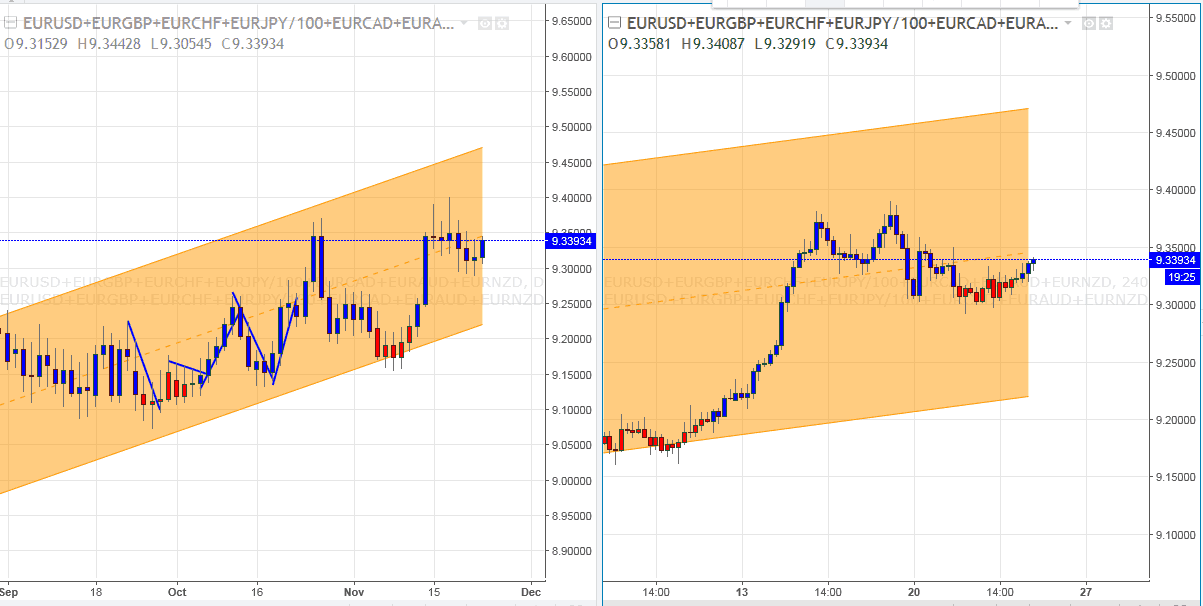
The next step in my preparations is to look at my own currency indicies where I’ve made an index for each currency of its own. Those of you that get my weekly market analysis will recognize these indicies from the report. But it shows the strength of each currency compared to all the other in one chart. Here are the two charts for EUR and CAD on this specific day:
EUR
CAD
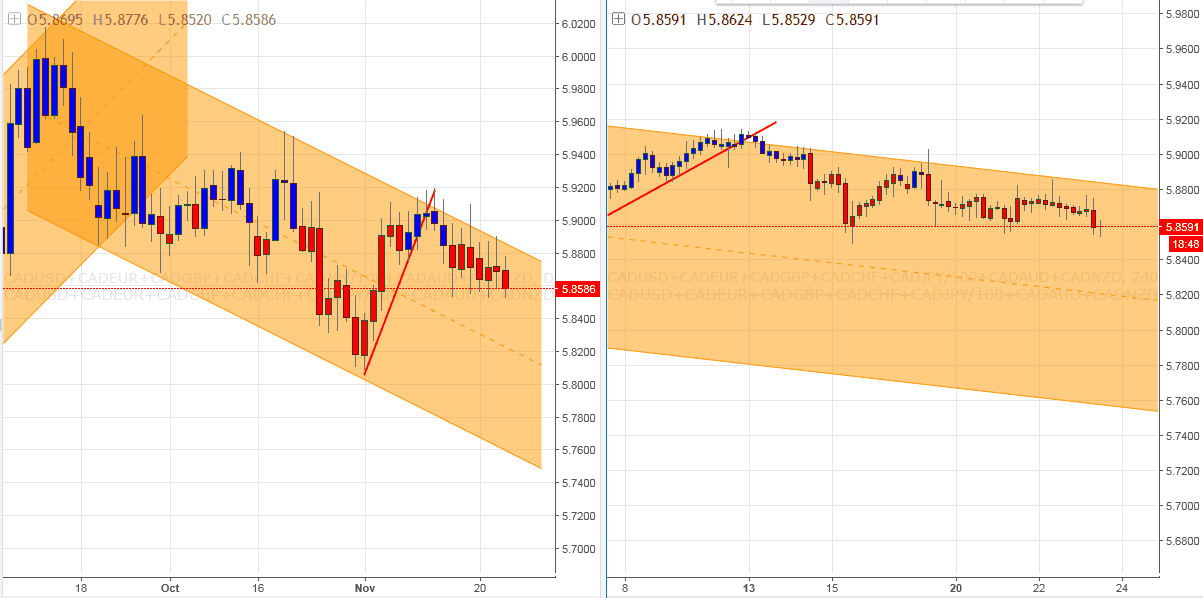
As you can see above we have the EUR and CAD strength measured to all the other major currencies in the market. These charts show me that EUR is strong on both daily and 4Hr chart and the CAD is weak.
As always when I enter a trade in Forex I always want one of the currencies to be strong and the other to be weak. And here we have a strong EUR and a weak CAD which is perfect. This allows me to look for a long EURCAD (long EUR and short CAD).
Overview of currency indicies
The analysis that I showed above for EUR and CAD I make twice per day for the 8 largest currencies and put them in a spreadsheet like this:
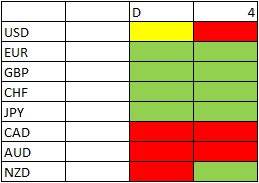
This gives me the opportunity to get a quick overview of which pairs I should focus on. As an extra tool for this market strength overview I’m also using my own market scanner which is updated during the day and is showing the strengths in the market across all currencies and time frames.
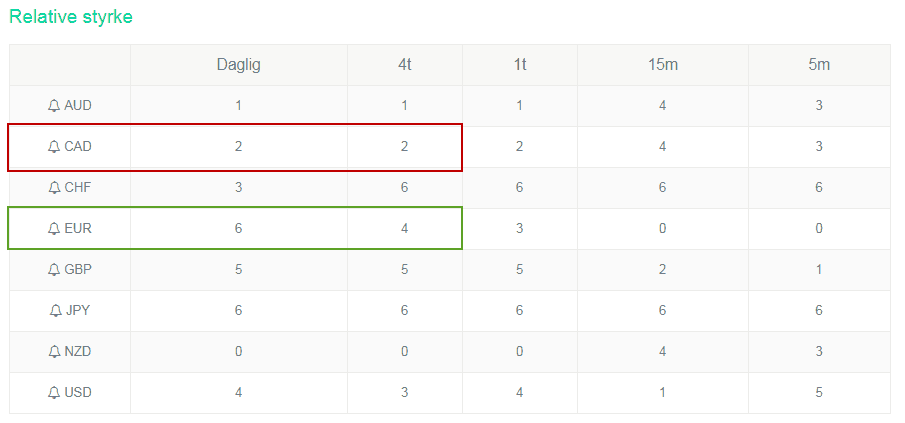
Chart analysis
Now that I’ve done my pre analysis I’m ready to look through the charts. Normally I’m left with 4-6 candidates after the above mentioned screening. But just because a pair has made it through the screening doesn’t mean that I get a trade signal. Some times I can go days without a signal. So let’s look at the chart for EURCAD
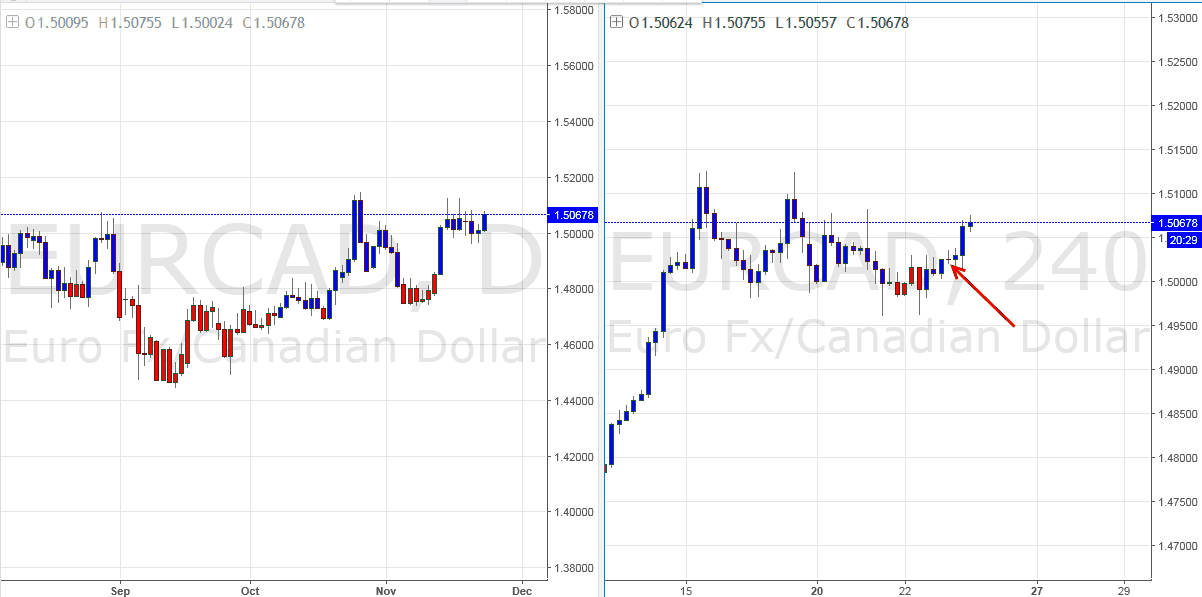
In my charts in this article I’ve used my own indicator that colors the bars blue and red when my trend criterias are met. And as you can see here the EURCAD has been colored blue the last days showing that I’m allowed to look for at long trade on the 4 Hr chart.
If you look at the 4 Hr chart (to the right) you can see a shift in color from red to blue in the night between the 22nd and the 23rd, so I was allowed to take a long trade when I opened my charts the 23rd in the morning. I knew that there where coming news from Canada in the afternoon so I was paying attention to that. But when I trade from the 4 Hr chart my trades are not too sensitive to news so I wasn’t worried. The numbers from Canada turned out worse than expected which helped my trade since I was long EUR and short CAD in this trade.
In the moment I’m writing this the trade is up around 0,7R (0,7 times my initial risk) but there is no guarantee that it ends in profit. By now my Stop loss has been moved slightly up but I can still lose 0,5 R if the price turns around now.
Summary
I hope this gives you an impression of how I work and prepare with market analysis before my trades and before the week begins. I also have a number of longer term analysis tools that I havn’t described in this article but I might write a piece about that later on. These tools should also support the direction of the trend which they did here.
With this work flow I spend very little time on actual trading in front of the screen and very much time on my pre market analysis. Every weekend I’m spending 6-8 hours making my weekend analysis and on evaluating trades I took during the week. This way I only spend ½-1 hour trading per day which makes my day a lot less stressful. This gives my the energy to make my analysis and to make solid trading decisions.