You often hear daytraders say something like “I’d like to see some bullish price action before I go long” – but what does that mean? We will try to cover exactly that in this article. However, there is no exact and clear definition of price action. Daytraders also use widely different definitions. We will try to describe the most common terms here.
What is price action?
Price action is price movement. In other words, price action is the movement in the price of a financial instrument, which can be anything from stocks, commodities, currencies and bonds. If the price of an instrument goes up quickly, one can say that it’s a bullish form of price action.
Examples of price action
The classic chart patterns like Head and Shoulder, Bull and Bear Flag and Double Bottom / Double Top are all examples of price action.
Another example of price action is candlestick formations. This could be a Bullish Engulfing candlestick, an Inside Bar or something that is all generated by price action.
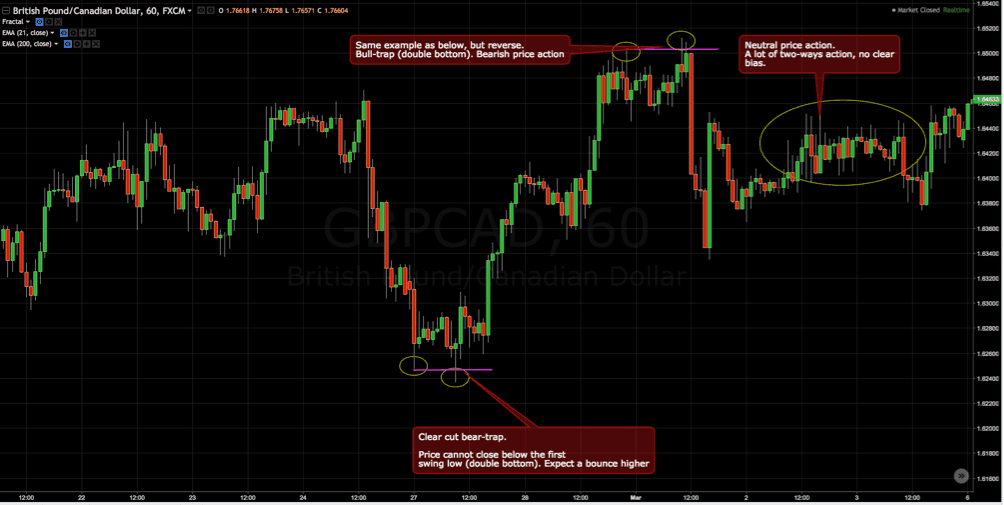
Below are two examples of bullish and bearish price action and an example of neutral price action (and yes, that’s just my subjective analysis of price action).
How is price action created?
A third form of price action is the activity between buyers and sellers. This is called “order flow”. There are some who think this is the pure form of price action as it is what 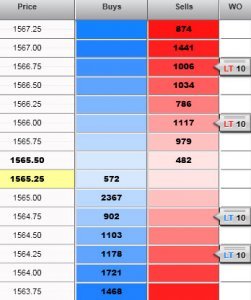 creates price movement. To the right is a typical order book, where you can see the buy and sell orders.
An example of order flow price action is when a day trader buys DAX futures directly at market. Then his market order will help to “lift” the price. Conversely, a seller selling DAX futures directly at market will help push the price down. Order flow can be seen if you trade futures contracts. On a platform where futures contracts are traded, you will be able to see the order book and the number of buy and sell orders at the 10 nearest prices. Typically, you do not have access to an order book when you trade CFD contracts, as there is no central exchange for this.
Price action analysis
Like many other things in daytrading, analysis of price action is very subjective and can result in widely different analyses based on the same price action if you ask different daytraders.
When we talk about analysis of price action, it will typically be in the form of candlestick patterns, chart patterns and order flow. So, if I say, “I’d like to see some bullish price action before I go long” then in my case it will often be a particular candlestick pattern that I’m referring to. Which again is based on price movement, which I consider to be either bullish or bearish. It may be that another day trader interprets exactly the same price movement opposite to me.
Price action can therefore be a fairly diffuse concept. When trading price action, you typically do not use indicators, but only the chart and the different types of price action mentioned above.
We hope you got something out of the article. If you have any questions, feel free to ask them under the article here.