As I wrote the other day I saw some possible bull move in the Bitcoin market.
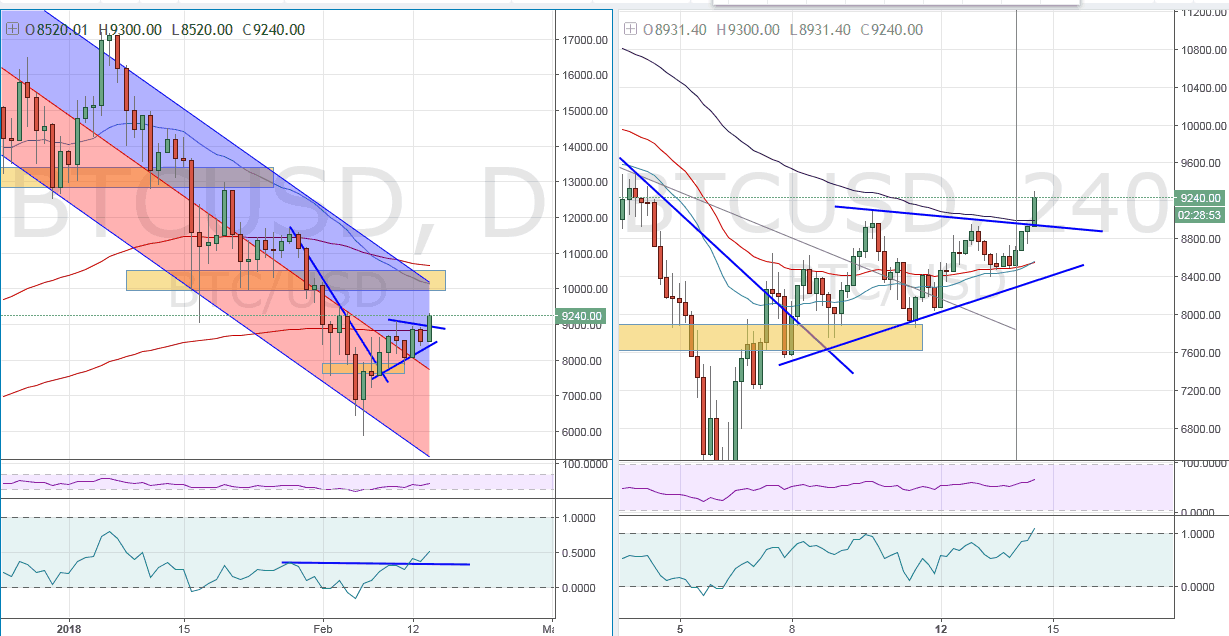
Now we have broken up through the yellow area (in the 4Hr chart to the right), then the price fell back to the support area and was sent further up from here. In this process the price made a triangle formation (also on the 4Hr chart) which now has been broken up wards with great strength.
As I see this break up I see a potential for reaching 10.000 usd as the next important resistance area. This is the area with the yellow box in the middle on the daily chart to the right.
It’s important to remember that we are still in a down trend on the daily chart. Now the top of the channel is down around the 10.000, so if this level is broken we might see some serious movement up wards. If the price is rejected at 10.000 it’s possible that we should down and test 6-7000 again. But right now I’m positive and I expect more bull movement in the BTC price.
