
Action / Reaction Lines (called A/R) is one of the secret concepts of technical analysis.
It’s hard even from a Google search to find correct information about the concept. This article is therefore written based on several books about geometry and from experience with them in my own daytrading.
What are A/R lines?
A/R lines belong to the technical category: Geometry. Within technical analysis you can analyze vertically, horizontally and diagonally. A/R analyzes diagonally, which means we analyze both price and time.
A/R lines are based on Newton’s Third Law:
For every Action, there is an equal and opposite Reaction
A/R came seriously through Roger W. Babson and Alan H. Andrews back in the 1960s and 1970s, where a 60-page course was sold for a total of $ 1,500, which was a lot of money at that time.


Babson claims, among other things, that A/R was the tool which gave him a fortune of over $ 50,000,000.
Perhaps more of you have come across Alan Andrews, who is the man behind the pitchfork. The pitchforks are based on the same technical concept that each action has an identical counter reaction.
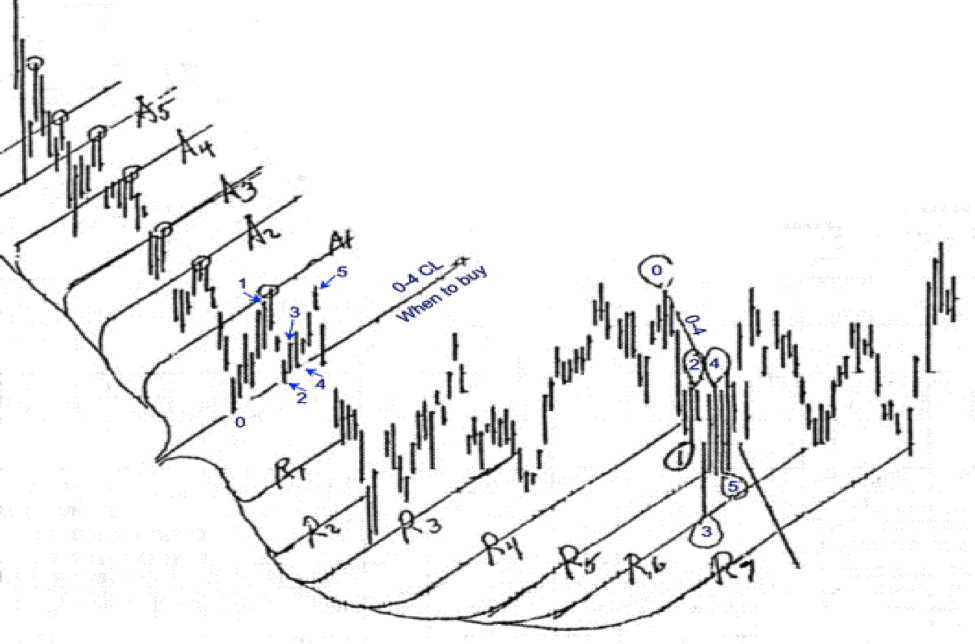
The easiest way to learn to draw A/R lines is by drawing a channel. Then project the channels on top of each other. The projected channels become the reaction lines, which show future price targets.
Example of Action / Reaction lines in DAX
This process is reviewed on the following images, which show DAX on a 1-hour chart.
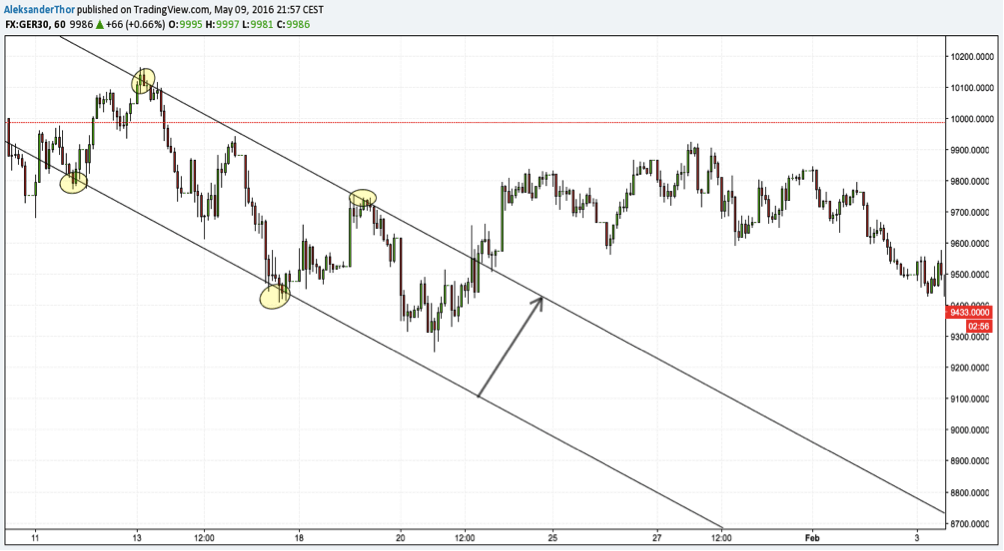
As shown in the above pictures, we copy the first channel and project it further so that each arrow has the same length. If the first channel is broken, the next channel will be the target for the price. At next break (at arrow number 2) we will re-project the channel, which will then work as the next target.
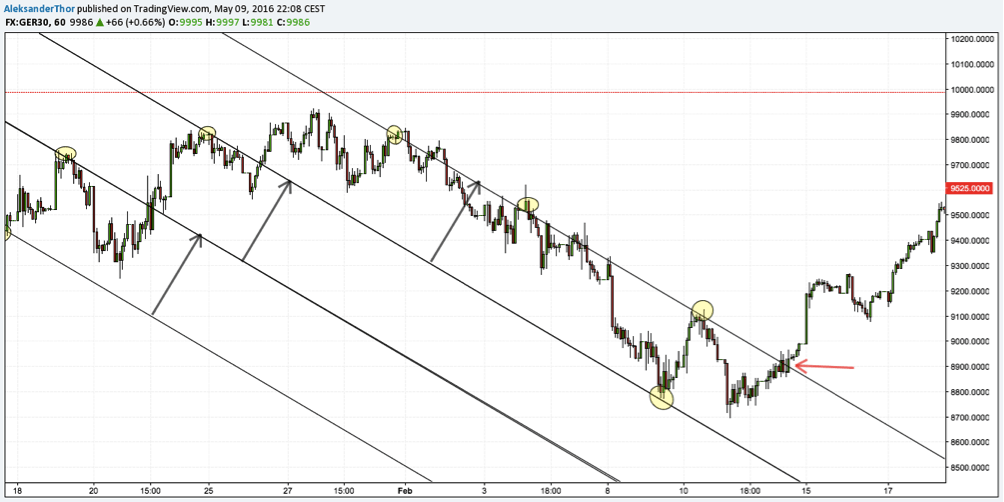
You can clearly see how channel number 3 is acting as resisting for the market. At the red arrow, the price breaks the third channel. That is why we are projecting the channel again. The next channel top works as the next price targets.
These A/R lines are great for creating additional confirmation around a turning point.
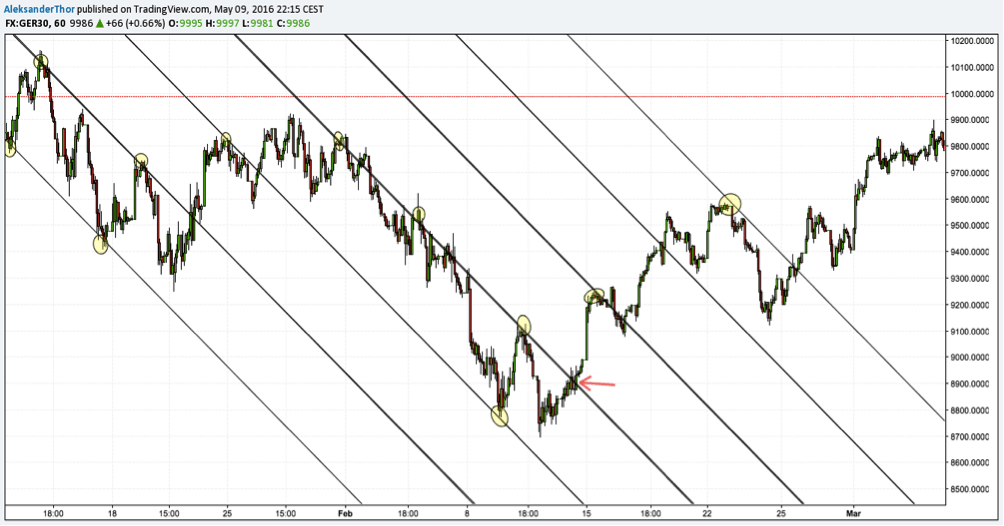
Example of application of Action / Reaction lines in forex trading
Let’s take another example in EURUSD on the 4-hour chart.
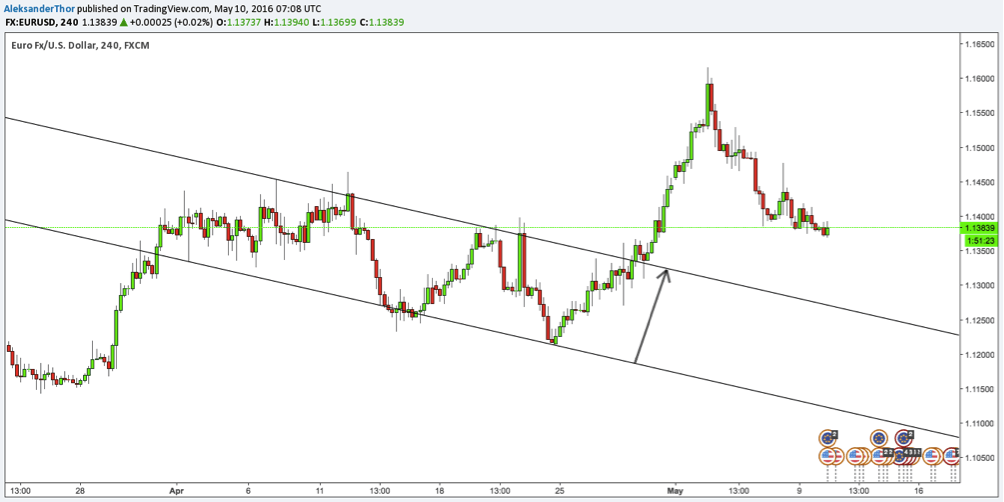
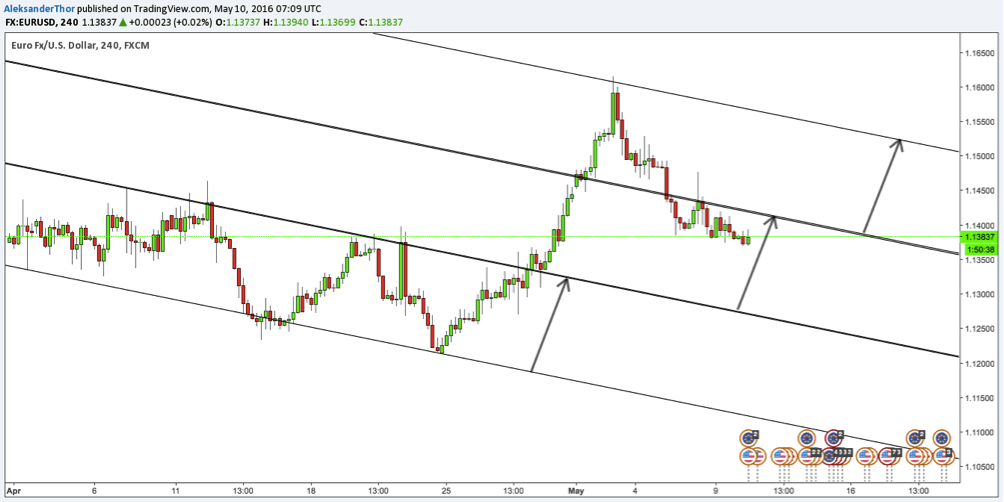
Once again, the A/R lines become the turning point for the price.
Action / Reaction lines are very useful
The A/R lines can be used in many ways, and they are also used in the article about The Bat Pattern. I use them personally often in my daytrading combined with Wolfe Waves, as illustrated in the picture below.
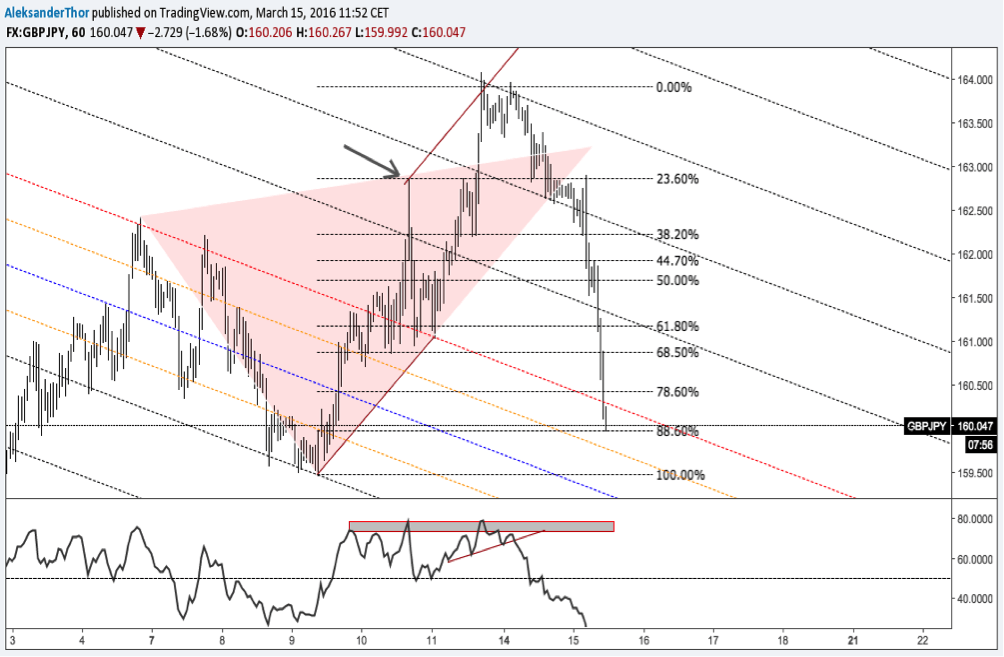
In the picture above, more techniques are used. First and foremost, A/R lines, which are the dotted lines, which make up the peak in the Wolfe Wave. In addition, a Fibonacci grid is used, as we have previously discussed in the article about Fibonacci numbers. Initial confirmation also shows a so-called Head and Shoulder Formation in the RSI Indicator, which is an indicator I personally use a lot in my daytrading. We have previously written several articles about the RSI indicator as well as the correct use of the RSI indicator.
We are working on making a video about action / reaction and geometry in the market.
Until then, you are welcome to ask questions or comment on the article.