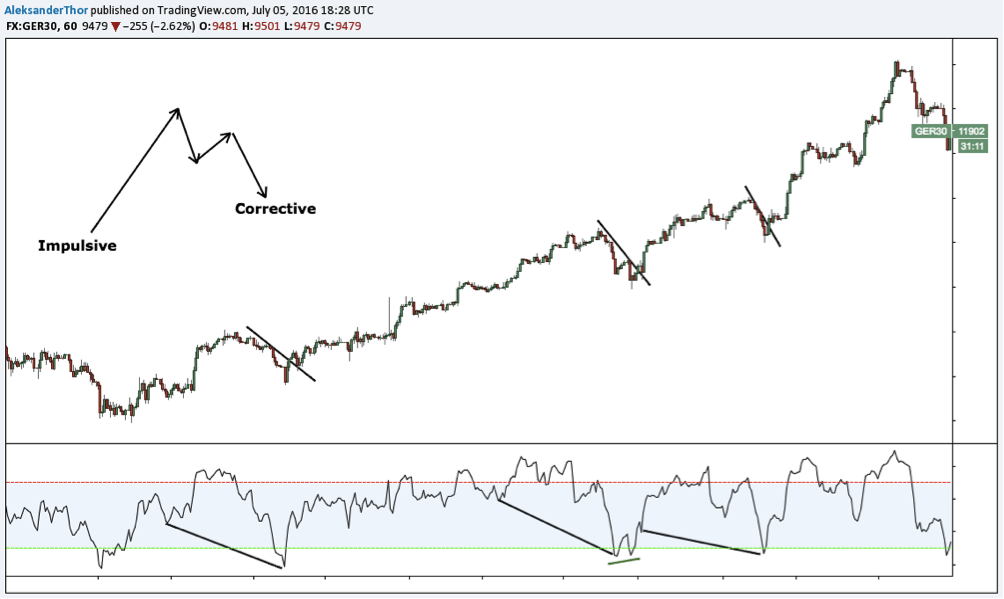
In Elliot Wave theory, one distinguishes between Corrective Waves and Impulsive Waves.
A Corrective Wave is defined as a movement against the primary trend.
That is, a so-called pull-back.
An Impulsive Wave is defined as a powerful movement where you are not in doubt about the direction of the market. This is usually the start of a new trend or a continuation of the trend.
In this article, we will look into Corrective Waves and how to handle them successfully.
What characterizes a Corrective Wave?
A Corrective Wave can have many different shapes. The shape itself is less important. Instead, focus should be on locating these attractive movements when they occur.
The most common form is a zig-zag. A zig-zag less about a classic ABCD formation, where the two longest legs are the same length. We have previously written about this formation in the article on Harmonic Patterns. A zig-zag can also take shape, like a flat ABCD or an expanding ABCD.
Example of Corrective Waves
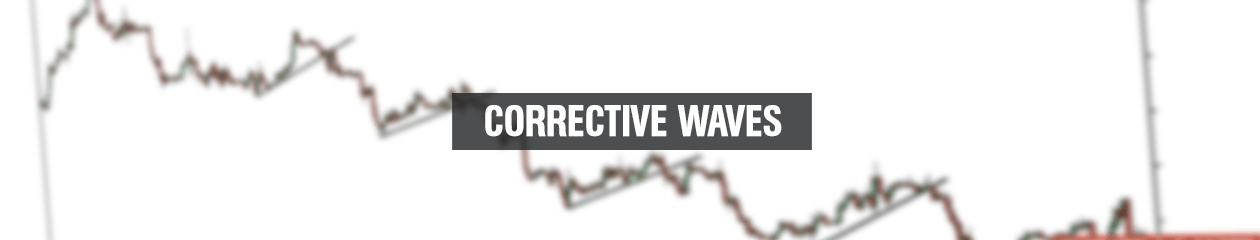
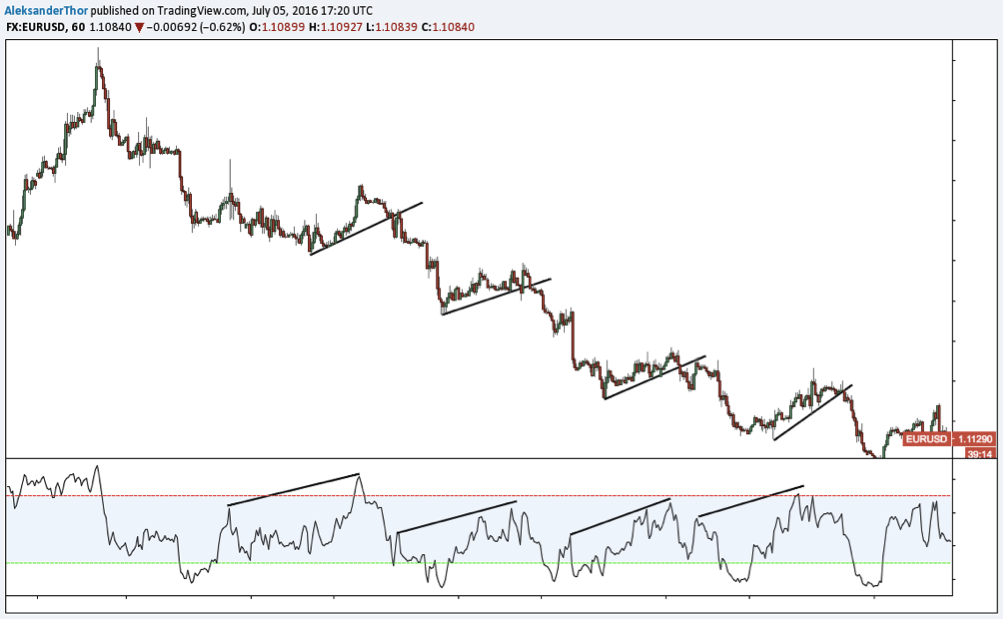
Let’s start by looking at a 1-hour chart from May 2016 for EURUSD.
First of all, we can see that the trend is downward. The price makes lower lows and highs, which is the definition of a downward trend. Along the way, the downward movements are broken by short upward movements. These are these Corrective Waves or so-called pull-backs, which we are interested in daytrading.
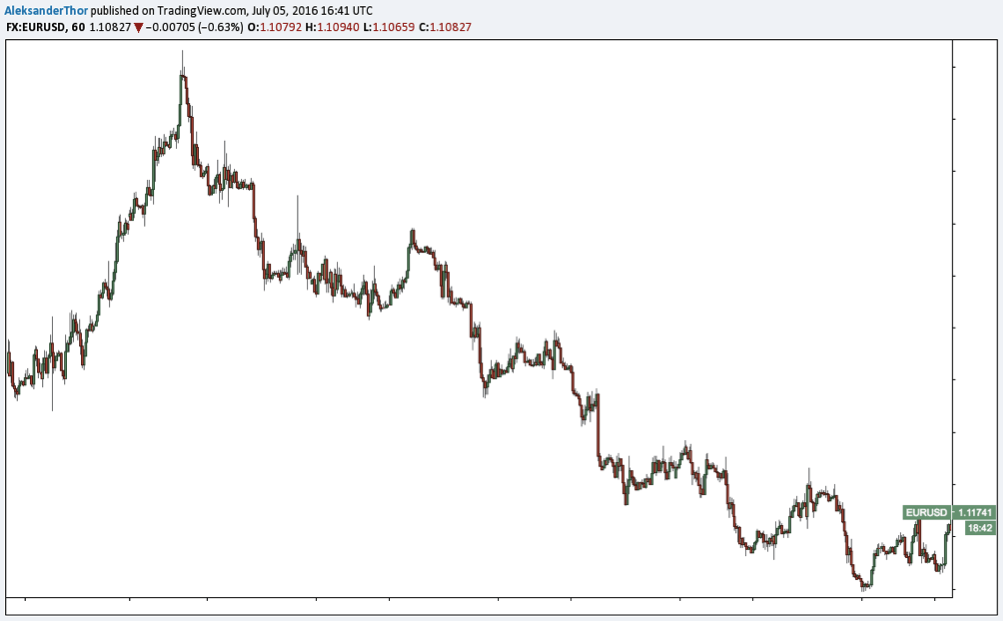
They are highlighted in the graph below:
By most Corrective Waves you can see how the price rises slowly and with difficulty. This is in contrast to the downward movements, where the price drops fast with long red candlesticks. Most often, the volume is lower in Corrective Waves, which signals a low interest from the buyers.
How do you trade Corrective Waves?
The question is then how do we trade these movements?
The answer is that you use several different methods. A good method is harmonic patterns, but I will describe my preferred method below.
Short-trade with Corrective Waves
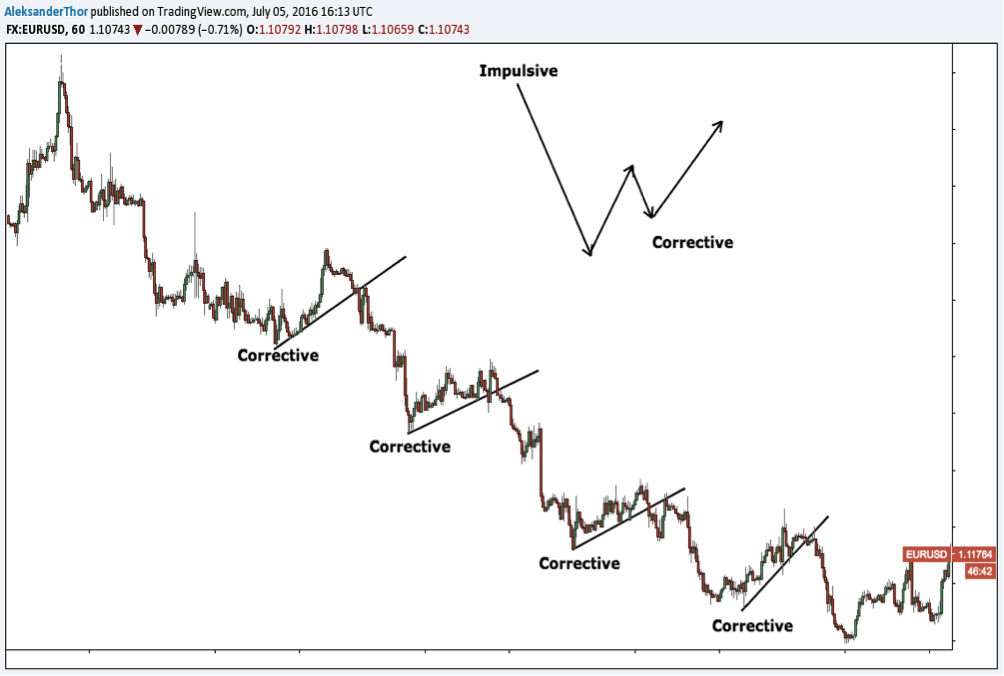
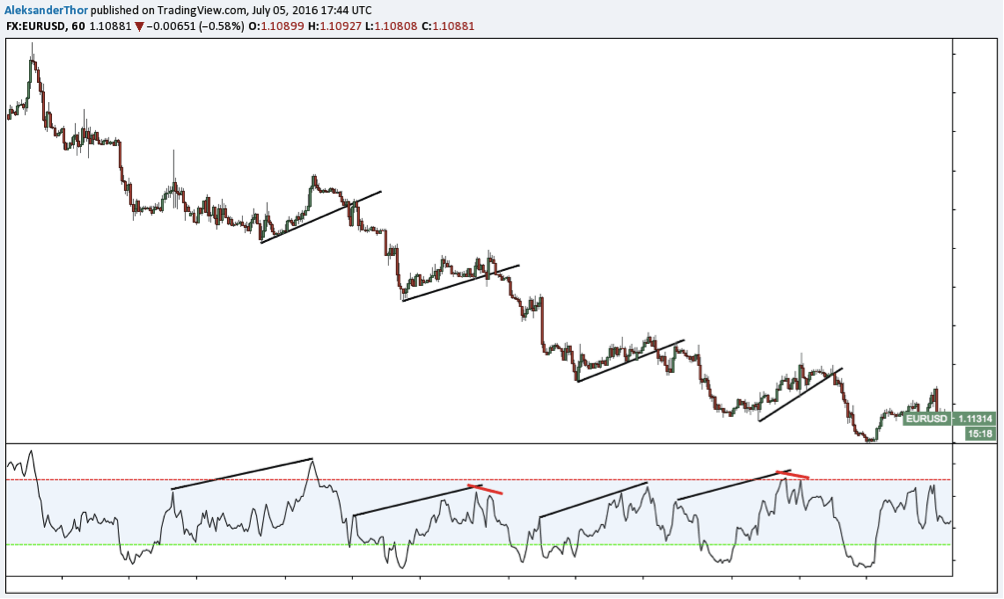
In the graph below, the RSI indicator is plotted with settings 14 and HLC / 3.
Note how the RSI indicator moves in Corrective Waves. Can you see the connection?
A small hint is divergence – or rather hidden divergences.
The connection is that the RSI indicator makes a higher high while the price makes a lower high. The divergences mean there is a greater likelihood that the violation of the trend line is valid. These divergences do not always occur, but when they do, it often means a continuation of the trend.
We can do better yet. The sharp eye may see that there are also small negative divergences built into some of the hidden divergences. When these two forms of divergence occur in continuity while we break the trend line, we have what the theory calls for a high probability short setup.
Although this setup is a high probability and successful short-term trading pattern, keep in mind that there is still likelihood of losing and therefore always manage your risk.
It’s this way that I trade pull-backs – or Corrective Waves – with the greatest possible success in my daytrading.
However, for good reason, it should be noted that the movements themselves should be of a certain size. We are not interested in dealing with the small fluctuations, as there is a greater likelihood that we will be eliminated along the way. There will be more about below.
Long-trade with Corrective Waves
The graph below gives an example of an upward trend with associated pull-backs, where we buy at each break.
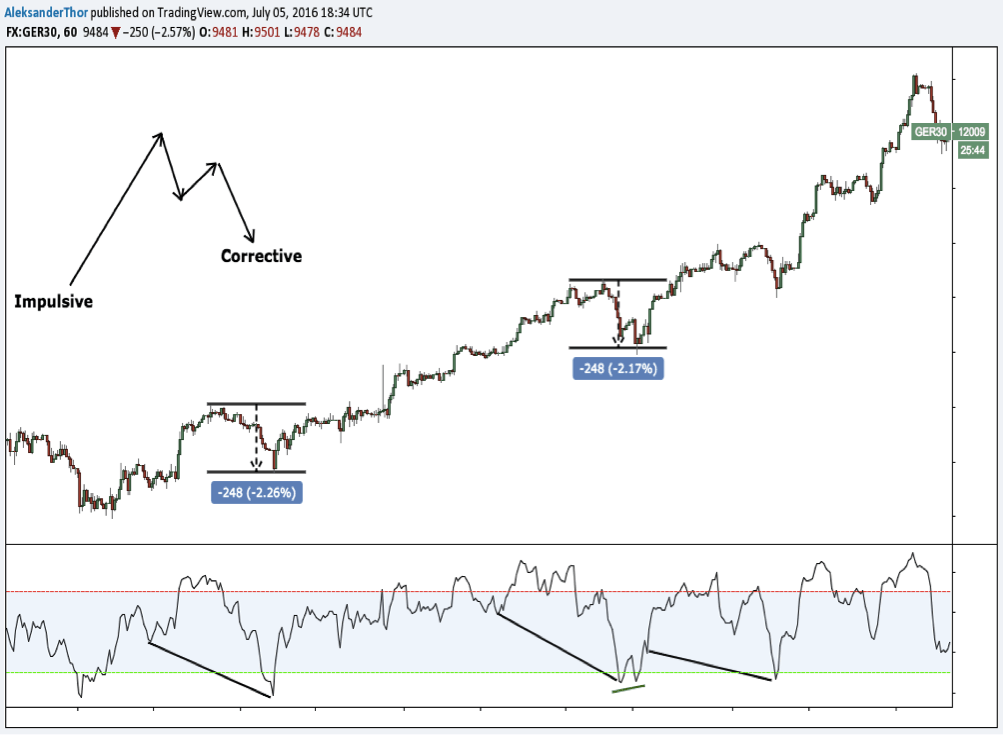
One last little trick to see if the movement is significant enough to act is to copy the size of the previous swing and then compare it with the current swing. On the picture below you can see that both swing is almost the same size (248 points). We would like to see this relationship when we trade Corrective Waves. You can also use the ATR indicator to measure the movement.
Summary on Corrective Waves
Keep in mind that the more picky we are with this method, the higher the success rate. In order to increase the frequencies of the trades, you can benefit from both index and forex.
I hope you found this article instructive. As always, you are welcome to ask questions or comments below the article.