
In a line graph, all the points are combined with one long line.
You can see an example below in the form of Novo Nordisk on a day graph, which means that each point on the x-axis corresponds to one day.
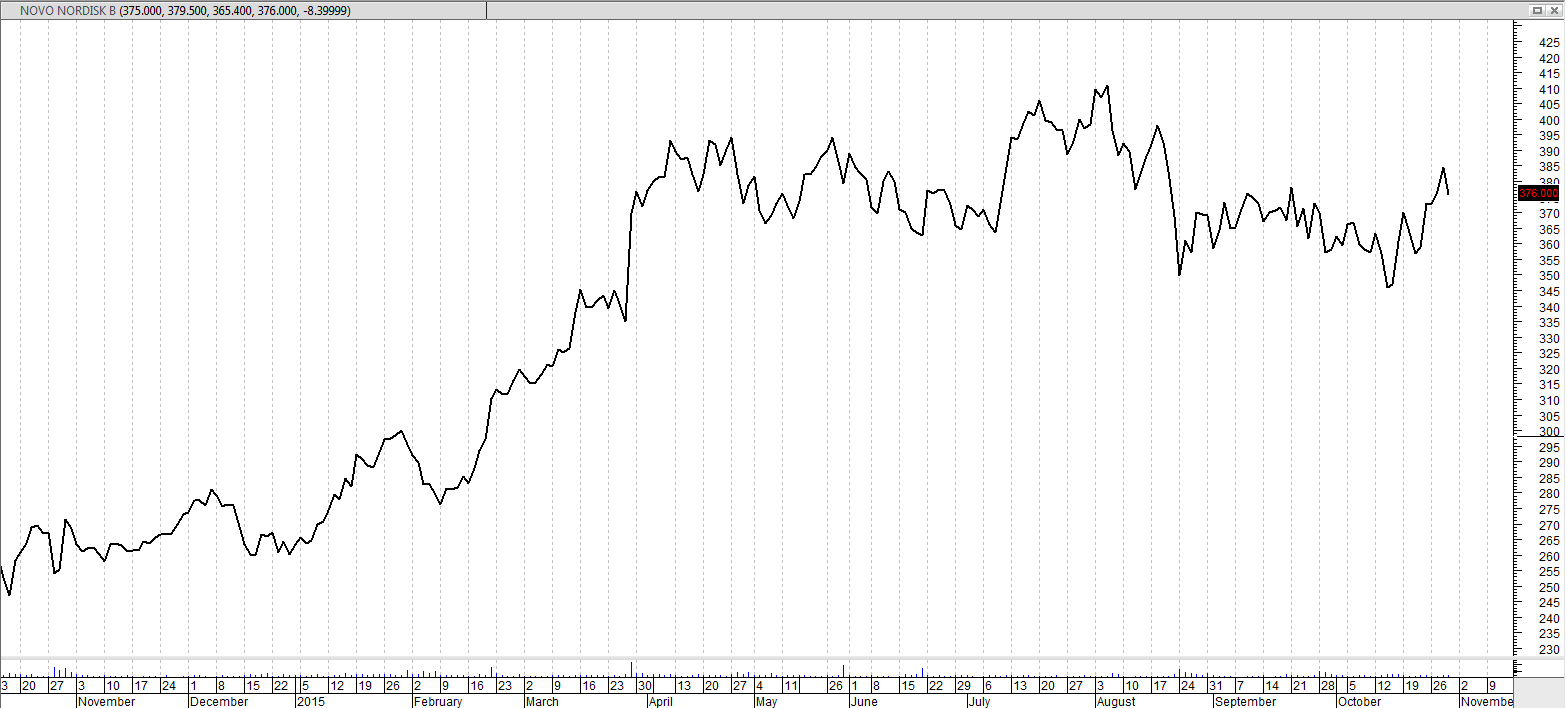
Some investors prefer this kind of graph if you want to get a quick overview of the development over time. But the fewest swing and daytraders use this graph as it simply does not provide enough information about the development within the graph.
The line graph is also often chosen when the media have to give a quick picture of, for example, the development of oil prices, the decline in the pound, etc., as it is easy to give a clear picture of an increasing or decreasing trend. The line graph works especially well when the graph is either not quite large (eg in the newspaper) or if you only have a short time to display the graph (eg on TV).
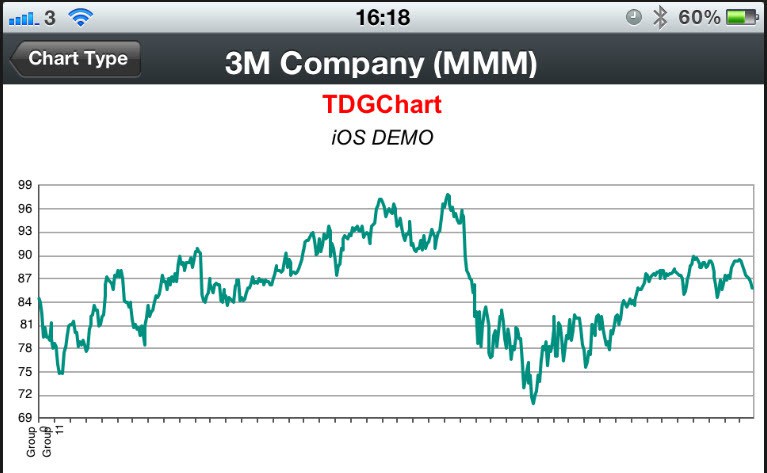
Just the graph’s clarity even with small pictures also makes many choose this graph when following the development of an investment in smartphones and tablets, where the image is small and only seconds to check development.
But after all, the line graph, as an analytical tool, is on its way out. The graphics on the portable media are so good that you can get good analytical graphs with the other types of graphs on tablets especially.
A historical angle of why line graphs were once the most popular type of graphs is that analysts have not always had the enormous computing power available today. Looking at Charles Dow’s first articles from the early 20th century, all of these are of course illustrated with line graphs. These could easily be plotted on a graph, and you did not need advanced math or quite a lot of time to keep their graphs up to date.
But today, they may seem dull to think about, as share analysis was conducted 100 years ago, even with the simplest indicator, such as a simple moving average took oceans of time to calculate.
So the conclusion is that the line graph probably will always have its place in the media and for the very fast updates. But I do not think it’s easy to find a daytrader today who prefers the line graph. Here the choice probably falls on either the bar graph or the candlestick graph.
Video
Below is a video that elaborates on the article and comes with several examples.