
If you ask Thomas Bulkowski and look at the statistics of candlesticks and their performance, the engulfing candlestick is one of the best-performing patterns. So it’s important that you have it in your daytrading toolbox.
In this article, we will focus on the candlestick’s structure and definition, examples of it, as well as detailed statistics on multiple markets so you can use it in practice and better assess the odds of success.
The pattern is most often seen at the start of an upswing or downturn. In other words, it’s a reversal candlestick, which signals a shift in the trend. Ideally, it shows when either bulls or bears have taken control of the market. The pattern consists of two candlesticks, where the number two candlestick embraces the body of the foregoing and has a larger range.
“The basic definition of an engulfing pattern is that the second real body must engulf an opposite color real body”– Steve Nison
The following image shows how the pattern looks.
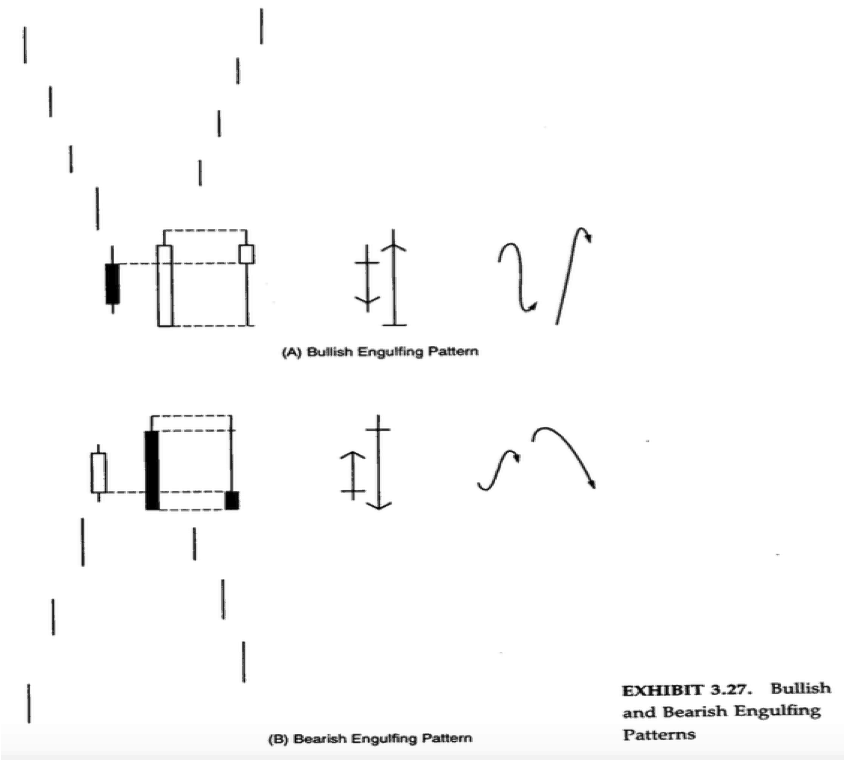
On a bearish engulfing we must have a candlestick that has a higher high, lower low, and a close that is below the previous candlestick’s low. There are several different definitions of this, but the aforementioned criteria are those that I have found performs best in backtest. The reverse is, of course, valid for the bullish version. There are examples of both below.
Engulfing Candlestick in DAX
In the following picture of DAX, you can see how the pattern looks like in practice. Notice how the excellent Engulfing candlesticks “engulfs” the previous candlestick. The important thing is that when we have a Bullish Engulfing we close higher than the previous high. When we have a Bearish Engulfing we should close lower than the previous low. If we can’t, it’s a sign of weakness.
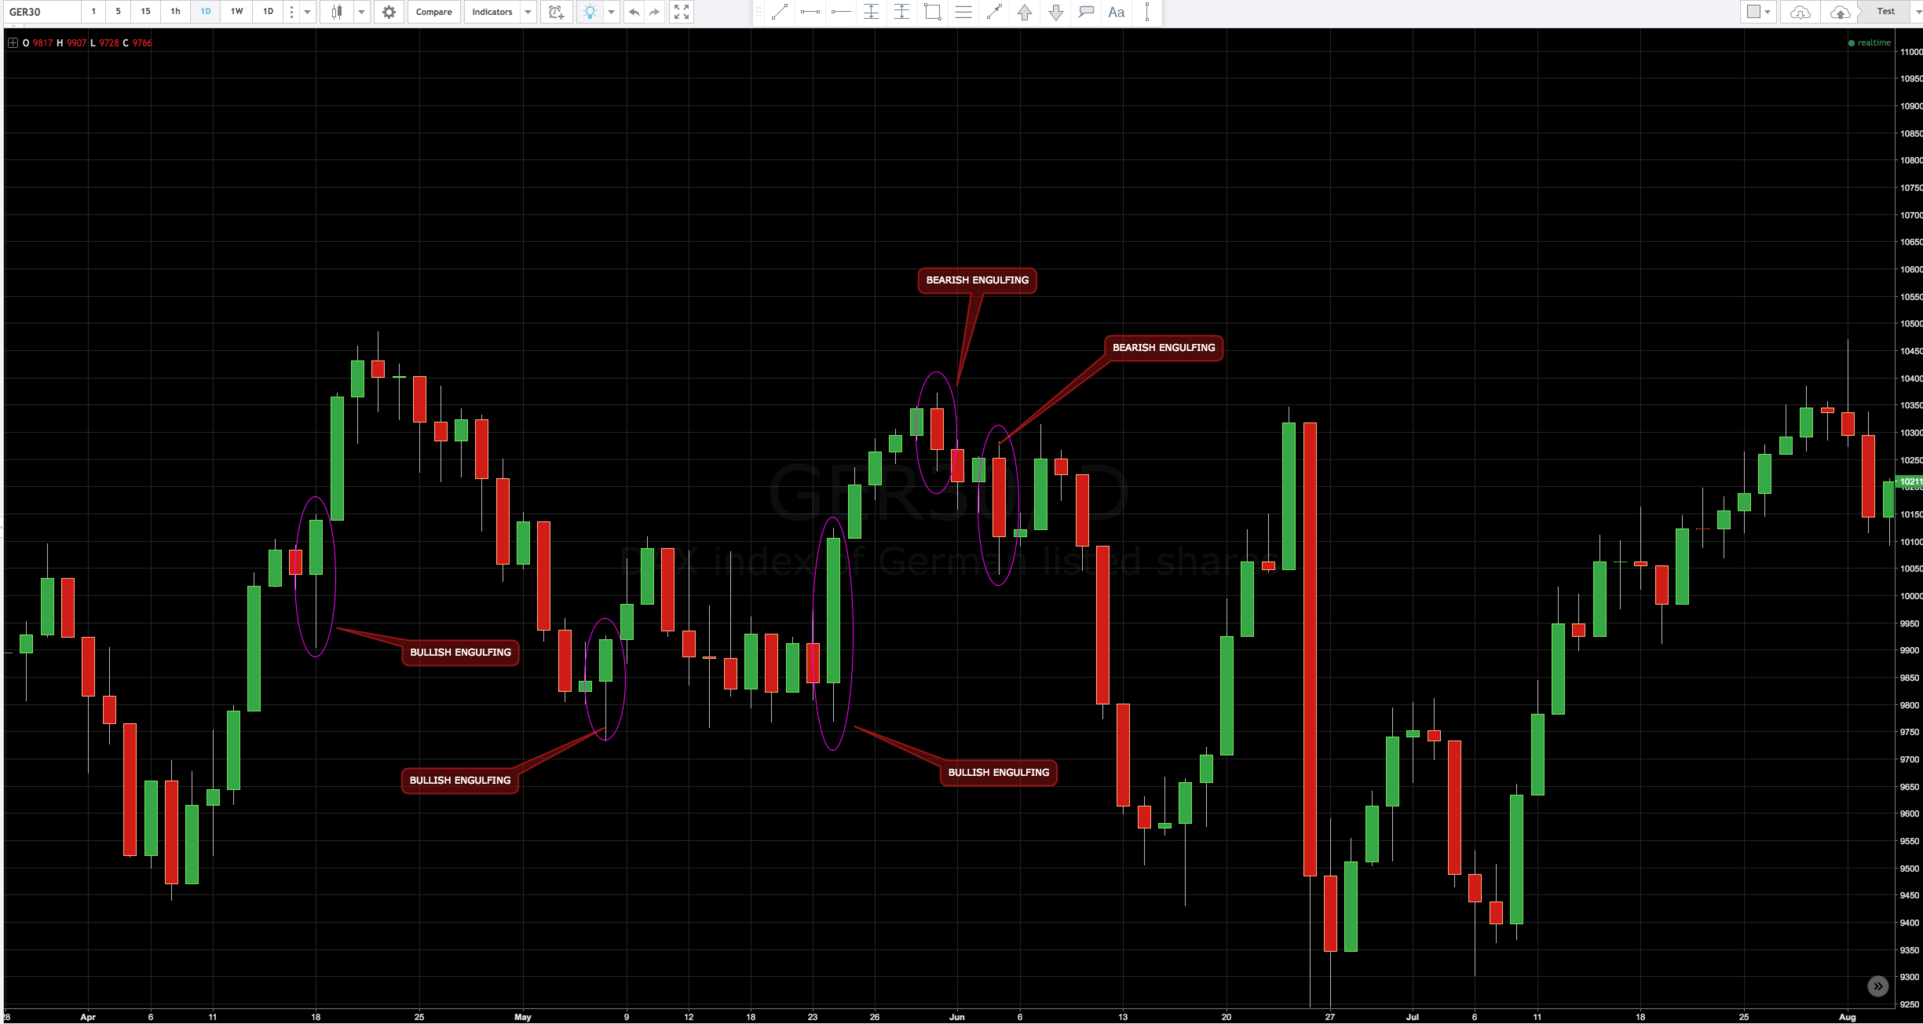
An Engulfing candlestick is valid until we break the extreme of it. That is, in the bullish example, it’s valid until we’ve broken the high on the Bullish Engulfing.
Engulfing candlestick in combination with other technical tools
You can then start combining engulfing candlesticks with some of the other technical tools we’ve written about here at DaytraderLand to get an even greater success rate with your daytrading.
A combination could be today’s ATR, where we are past today’s lower ATR, and where we get a bullish engulfing as an entry signal. This would be a Mean Reversion setup, where we would expect an increase back to the average. There was an excellent setup on DAX on the 5-minute graph the 15.2.2017.
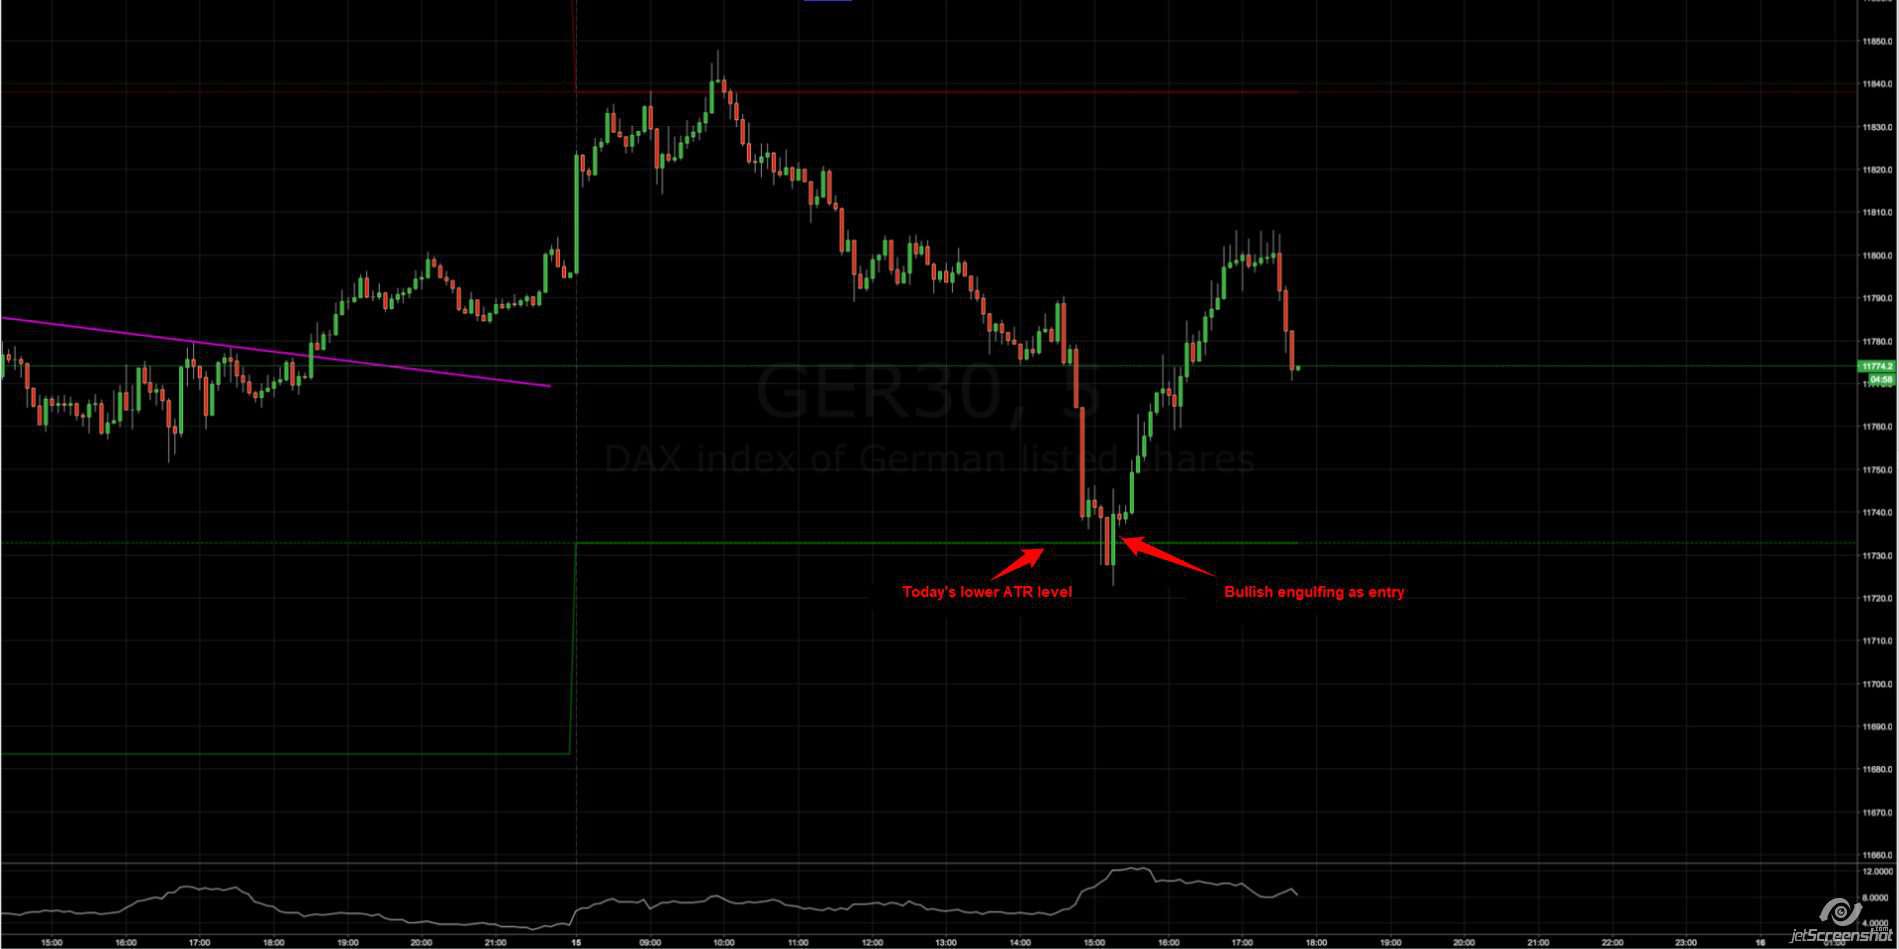
Combining candlesticks with technical indicators and price patterns in your analysis significantly increase the chance of success with daytrading.
But keep in mind that it’s not all the engulfing candlesticks, which means a turnaround in the market. Therefore, they should be used in conjunction with other techniques, as illustrated in the above image.
Statistics on The Engulfing Candlestick
In addition to using the pattern as an entry signal, I also use it as a bias for the day. For example, if there is a Bearish Engulfing on the daily graph and the context also tells me that we need a reversal, I’ll lean more to go short the next day.
But, it is very important to me that I know the historical probability of these biases that I use. That’s why I backtest as much as possible. Below is an overview of the statistics on The Engulfing Candlestick on the daily chart of various markets. I have tested from 2009 to February 2017. What I’ve been interested in, is how often when we have a Bearish Engulfing, we make a lower low, as well as a lower close the next day. In addition, I’ve tested with the criterion that we should have had two positive days before our Bearish Engulfing, as I thought it would increase the likelihood of a negative day the next day, when we saw something reverse from. Generally, the odds increased slightly, but not overwhelmingly.
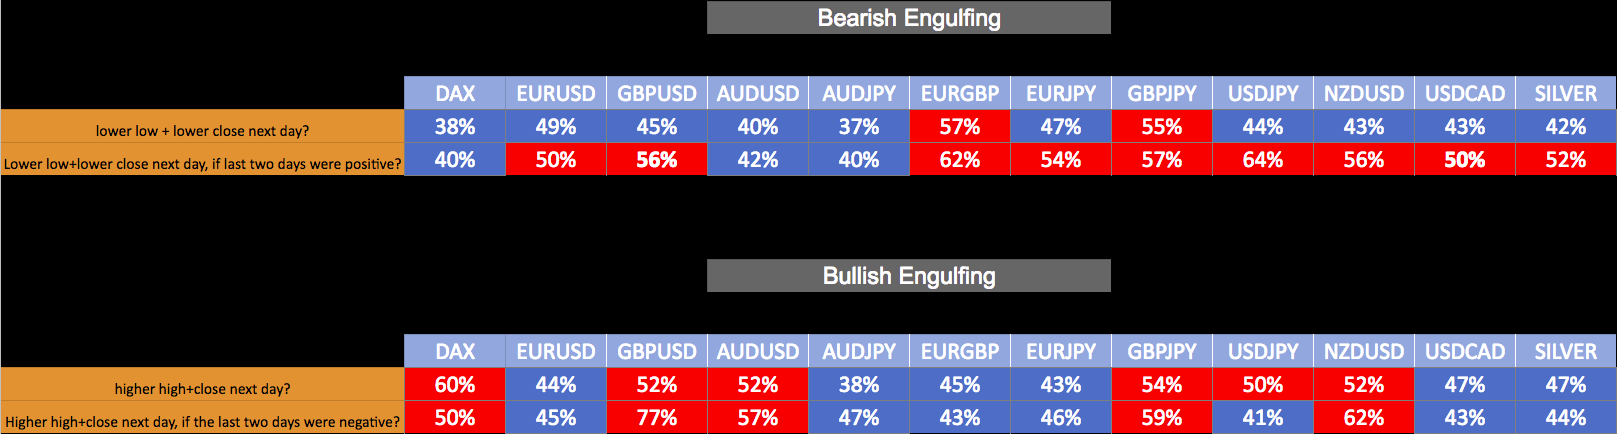
Therefore, the context is important to me when I use The Engulfing in my daytrading. The probability is just not strong enough that I can use it as an independent bias unless the context also plays in.
You can retrieve the two excel sheets D1 Bullish Engulfing (new – directed) (3) and D1 Bearish Engulfing (corrected) (new) (2) if it is of interest.
Video
Below is a video that elaborates on the article and comes with several examples.