
When you are a new daytrader and you start learning about technical analysis, you often meet a lot of exotic names on so-called chart patterns. It may seem quite overwhelming at first and be hard to overcome at the start, but nevertheless, it’s very important to be able to quickly spot these patterns if you want to succeed with your daytrading and become a profitable daytrader.
They can have many special names such as Head-and-shoulder formation, cup-with-handle, bull-flag, wedge formation, etc.
In this article, we will go through the wedge formation and explain the mechanisms behind the pattern, so you can use it effectively in your daytrading.
Do not worry, we write articles about all price patterns and share them with you for free here on DaytraderLand.
Let’s start out with the basics.
What do the price patterns show?
One has to make it clear that the only reason that the price generally moves on a share or in an index is that there is an intense struggle between buyers and sellers about what the instrument in question is worth.
A price quoted on a stock exchange is a picture of an auction between thousands of participants where everyone tries to get as much as possible for the item or stock they will sell and provide as little as possible for that item or share that they want to buy.
These constant clashes between buyers and sellers are exactly what constitutes the constant changes in the price, which gives us some interesting price patterns to look into.
An example of such formation can be seen in the graph below.
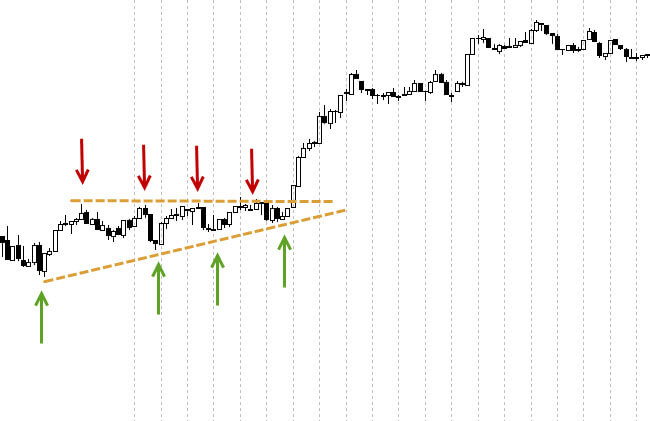
On the graph above we see the German DAX index on a 1-min graph.
However, both the specific instrument and the chosen timeframe are in principle irrelevant, as we use my knowledge of these formations and patterns across all markets and all timeframes.
The formation above is called a wedge formation. It is important to know, but as mentioned above, it is even more important to know why it occurs.
By the green arrows on the graph, we have indicated where the buyers really come in and push the price up. And by the red arrows we have shown where the sellers come in and push the price down. As described above, a price graph is a picture of an auction or a match between buyers and sellers, where the strength ratio between the two can be clearly read in the graph.
Here we see at the first green arrow that buyers are in excess and push up the price. A few minutes later, it will be enough for some of the market participants, and they choose to sell out and take profit (or it may be traders entering short). In any event, the price falls a little back.
The exciting thing is to see what happens next.
If the price had fallen deep below the start level, we could see that there was great strength on the sell-side. But what is happening above is that buyers become aggressive and create a new higher low on the price chart. It tells us that there are a lot of buyers who have not bought the first option and who want to get into the market quickly. They simply do not dare to wait for the price to fall back to the starting level, but feel the need to buy so they don’t miss the uptrend.
This repeats sometimes.
Each time buyers get into the same level, buyers are increasingly afraid not to come along so they buy faster and faster, which together gives the flat line on top and the sloping line at the bottom of the formation.
What happens when the formation breaks?
What often happens when such a formation is broken (from the flat side) is that one side – in this case the sellers – runs out of steam, after which the other – in this case the buyers – suddenly is in majority. When this happens, we usually wait a single bar more to make sure that the breakout is real and then we buy.
This is called a breakout from a wedge formation and is in itself a very profitable setup to look for when daytrading.
Combining such a setup with other indicators, time frames, etc., allows you to increase the chance of success with your daytrading considerably.
An example of an obvious short trade
An example of a breakout from a wedge formation can be seen in the graph below, which this time is a short trade.
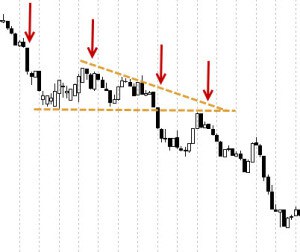
Here we see that DAX is already in a downward trend.
For a short period of time buyers are coming in and holding their hand below the price, while sellers just push the highs longer and further down. As the breakout occurs, we get a rapid fall, after which the price is retracing back to the previous bottom, which now acts as a resistance. Here the price is rejected as sellers are not in doubt about the direction and if you did not get into a short trade earlier, this option is obvious.
Fully understand the basic understanding of the market
Now we have given an example with a so-called wedge formation. There are many good formations to engage in, but as we mentioned earlier, you will get the best results if you carefully understand why they are formed, rather than simply learning a variety of patterns unconsciously outwardly.
In our daily daytrading we are constantly asking ourselves the question: Who is winning right now? Buyers or sellers?
This makes us focus on spotting the situations where the strengths between the two parties are truly revealed, and thus the future price trend.
We’ll be back soon with more articles on price patterns, which hopefully help you to spot the good trades in your daytrading.