So back from vacation. I hope you all had a nice summer.
Looking at DAX this week, then so far it has been a trading range. The price range is narrowing and protracted. This is a BO pattern on a larger timeframe. But until the BO comes I will trade it as a range. Buy low, sell high, and scalp. 80% of BO attempts fail.
Trade 1:
15 min chart:
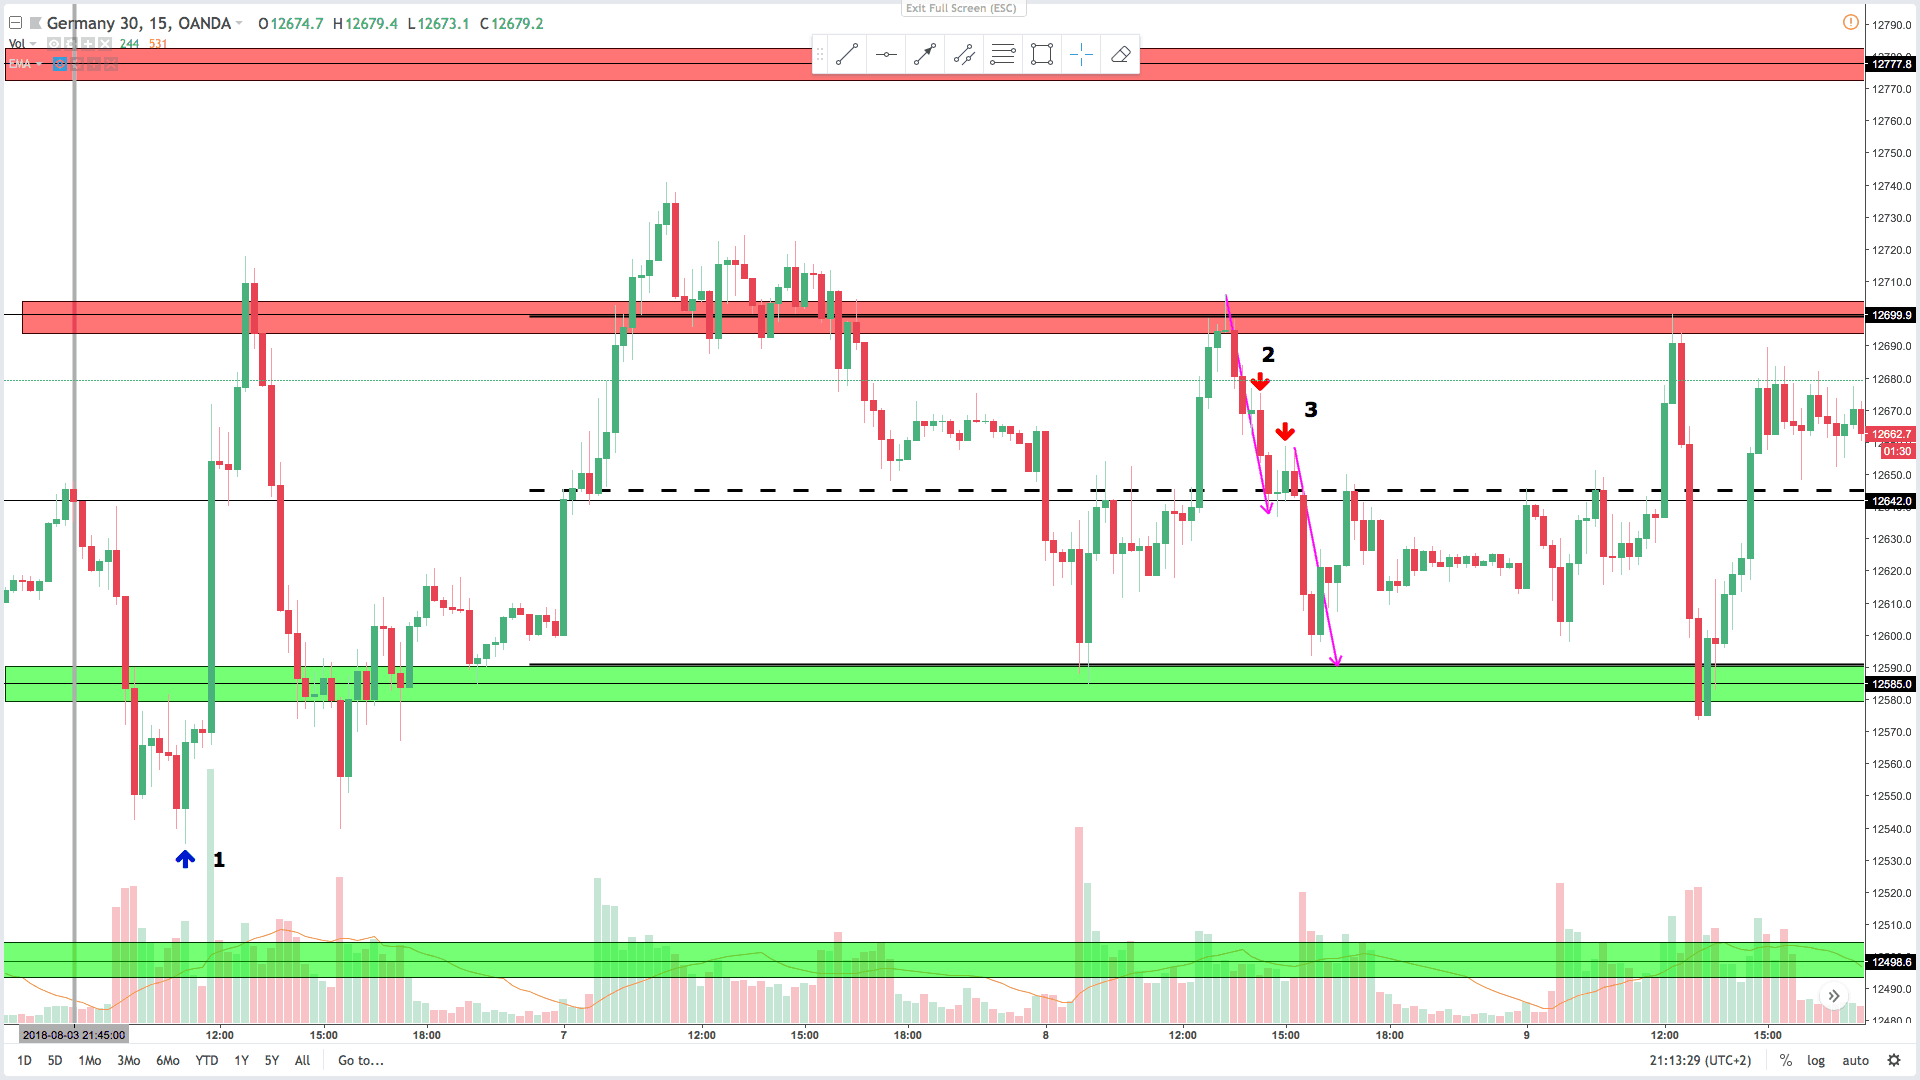
On the 15 min chart this is a nice double bottom setup. An open reversal and a risky trade. I talked about this trade in the video on monday. The large bull outside up bar on the 15 min makes this a nice setup on the 15 min chart.
5 min chart:
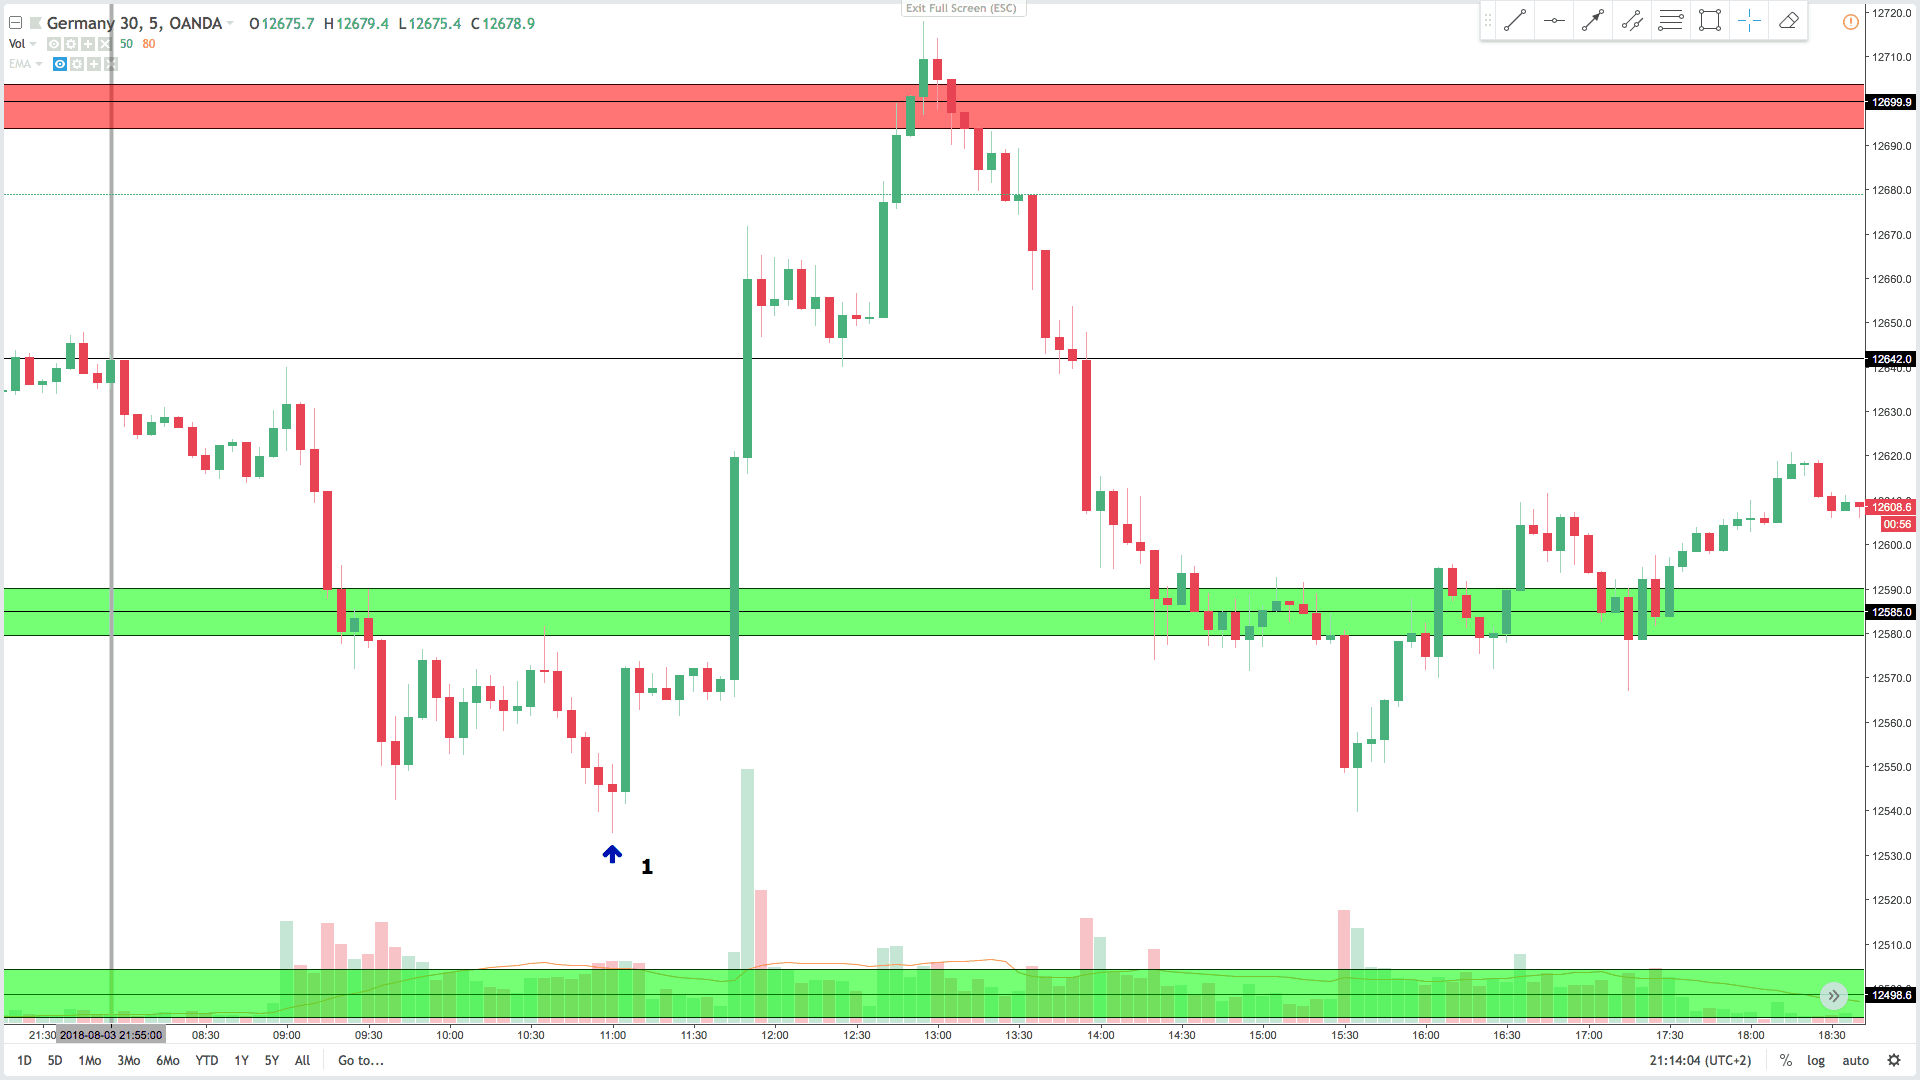
On the 5 min chart this is not the best setup. The better setup comes on the bull flag after the large bull bar. There is a high 3 and a failed second entry short. Sideways correction. So expect at least one more leg up. This was a really good trade 15 minutes later.
Trade 2:
On the 15 min chart price is coming of the resistance of the trading range. Price made a lower high. It’s not a good setup on the 15 min chart. But it is after a couple of strong bear trend bars which is in favor of a short trade.
5 min chart:
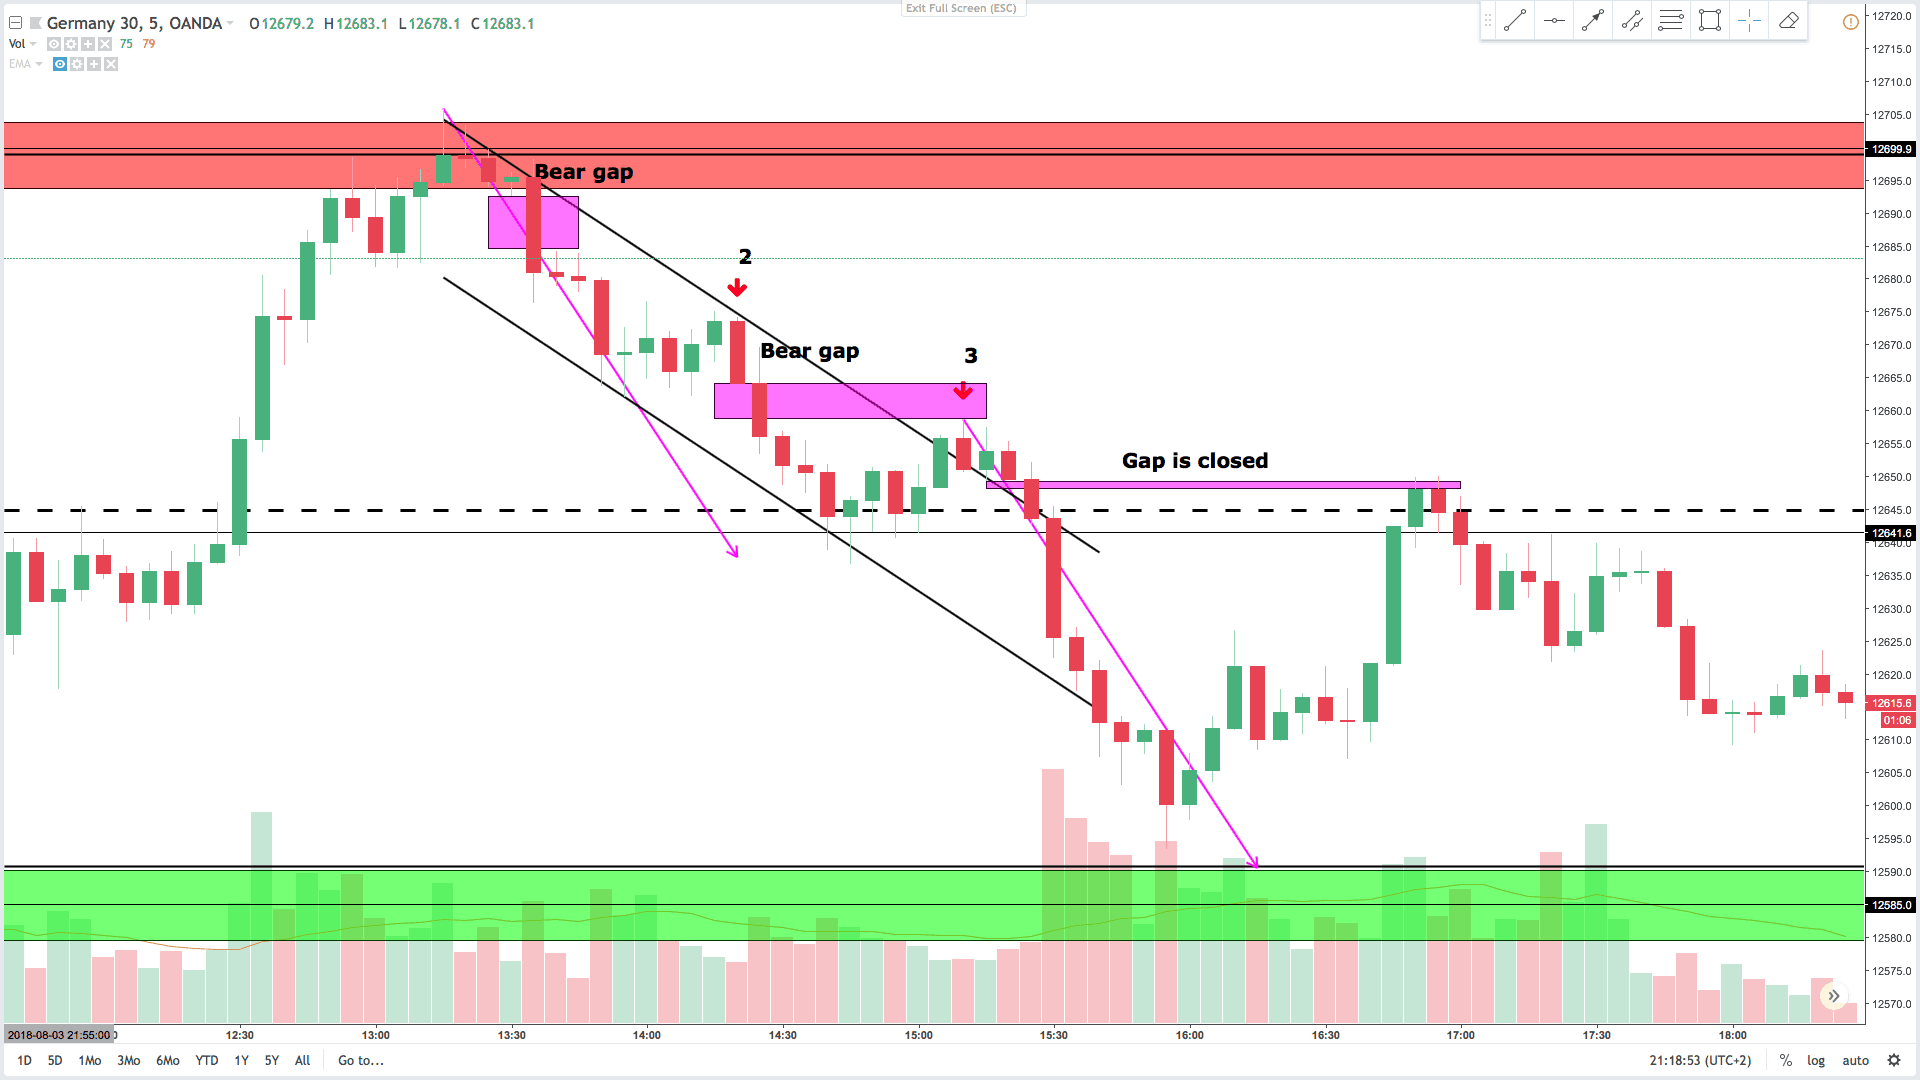
On the 5 min chart price made a bear gap on the resistance level. Breakeven stops was not hit on the pullback. This is a sign of strength on the bear side. This context makes the market always in short faster than if the gap was not present. The 2. trade is a failed second entry long and a second entry short sell signal. Also it hits a expected trend channel and confirms it. Now we expect at least a second leg down.
Trade 3:
On the 15 min chart this is a inside bear bar signal bar. This setup is in the middle of the trading range which makes it a bit risky. I like the bear strength. It closed the break even gap from the bull BO in the morning. As on the 5 min chart there is also a gap on the 15 min chart. And potential for a second leg down.
On the 5 min chart price broke the trendline, but made a second entry short signal at the trendline. It traded sideways and closed outside the trendline before selling off to almost a measured move down. Price broke below the channelline as well. This was the third push down and price traded sideways from here. When setups is as clear as 2. and 3. one must not hesitate to execute the trade.
Look for the spots where traders place their break even stops. If they are not hit, it is a sign of strength in that direction.
When a trade has low probability( is risky), then it often has high potential reward. If one wants more confirmation, that is higher probability- it comes in form of larger stops and smaller potential reward.
Great to be back. Have a nice trading week.
Feel free to comment if you have any questions.