The week began as a trading range, then price broke out to the downside. The BO failed and price bounced on a double bottom. Today price rallied strongly and broke several resistance areas. Price is always in long and look to buy and swing longs. I do expect price show deeper pullbacks. Friday will be interesting.
15 min chart:
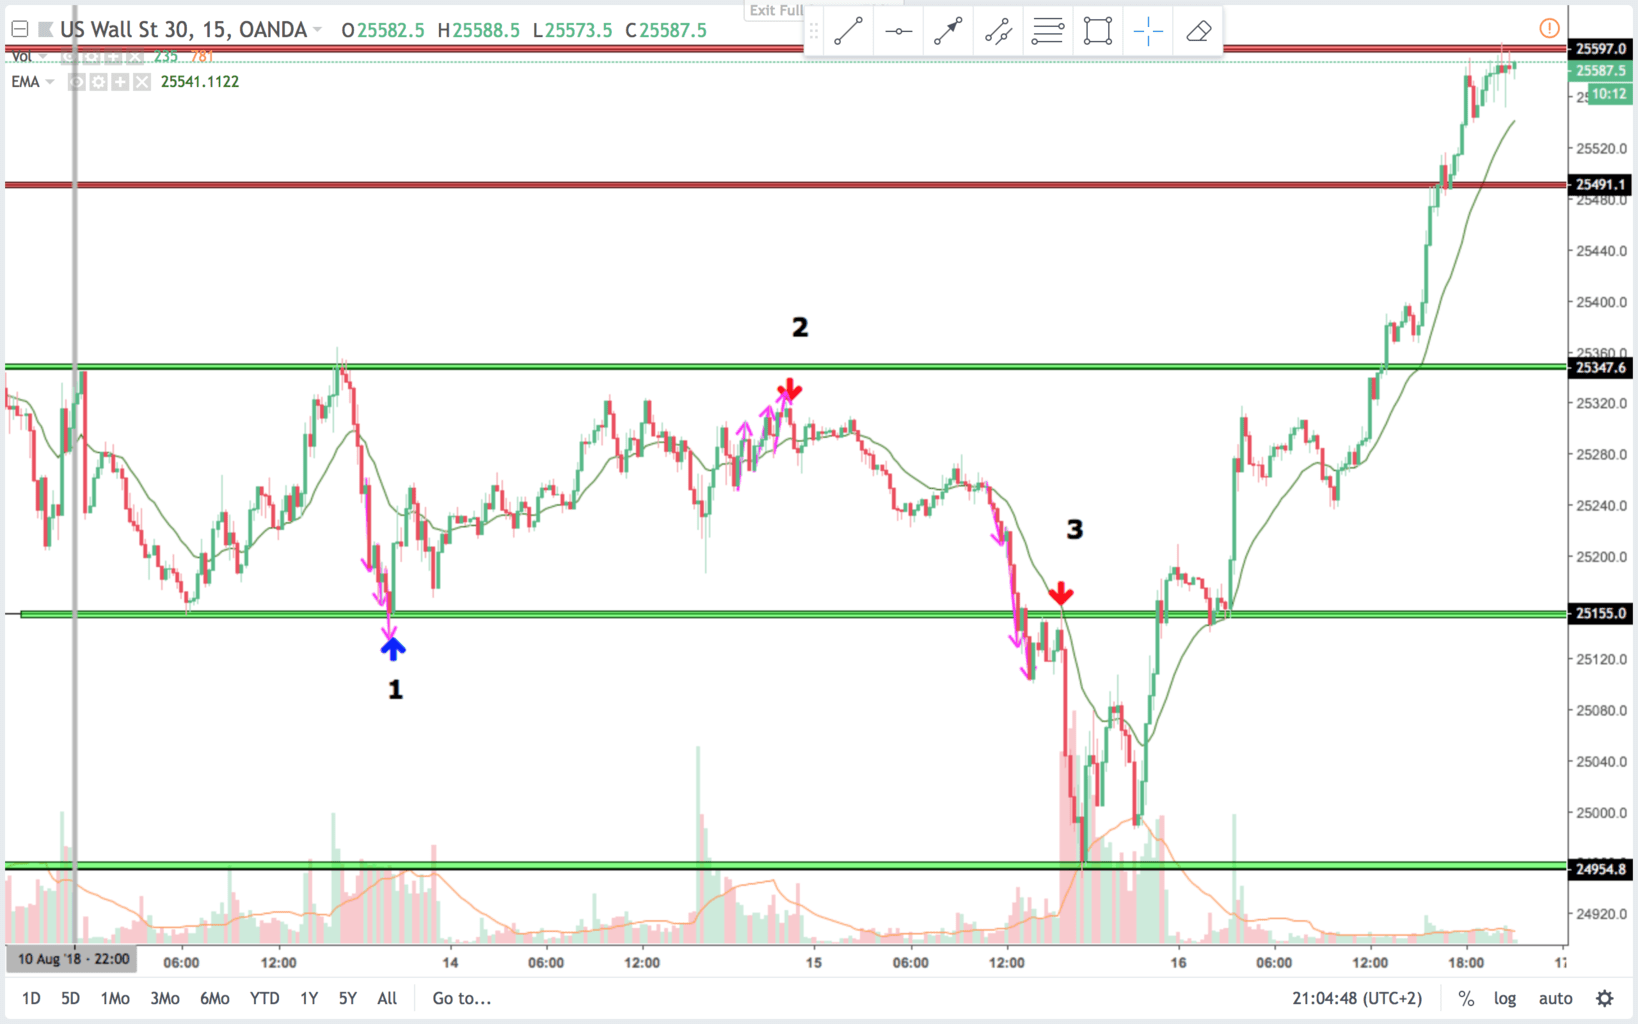
The theme of today’s analysis is three push patterns.
Trade 1:
15 min chart:
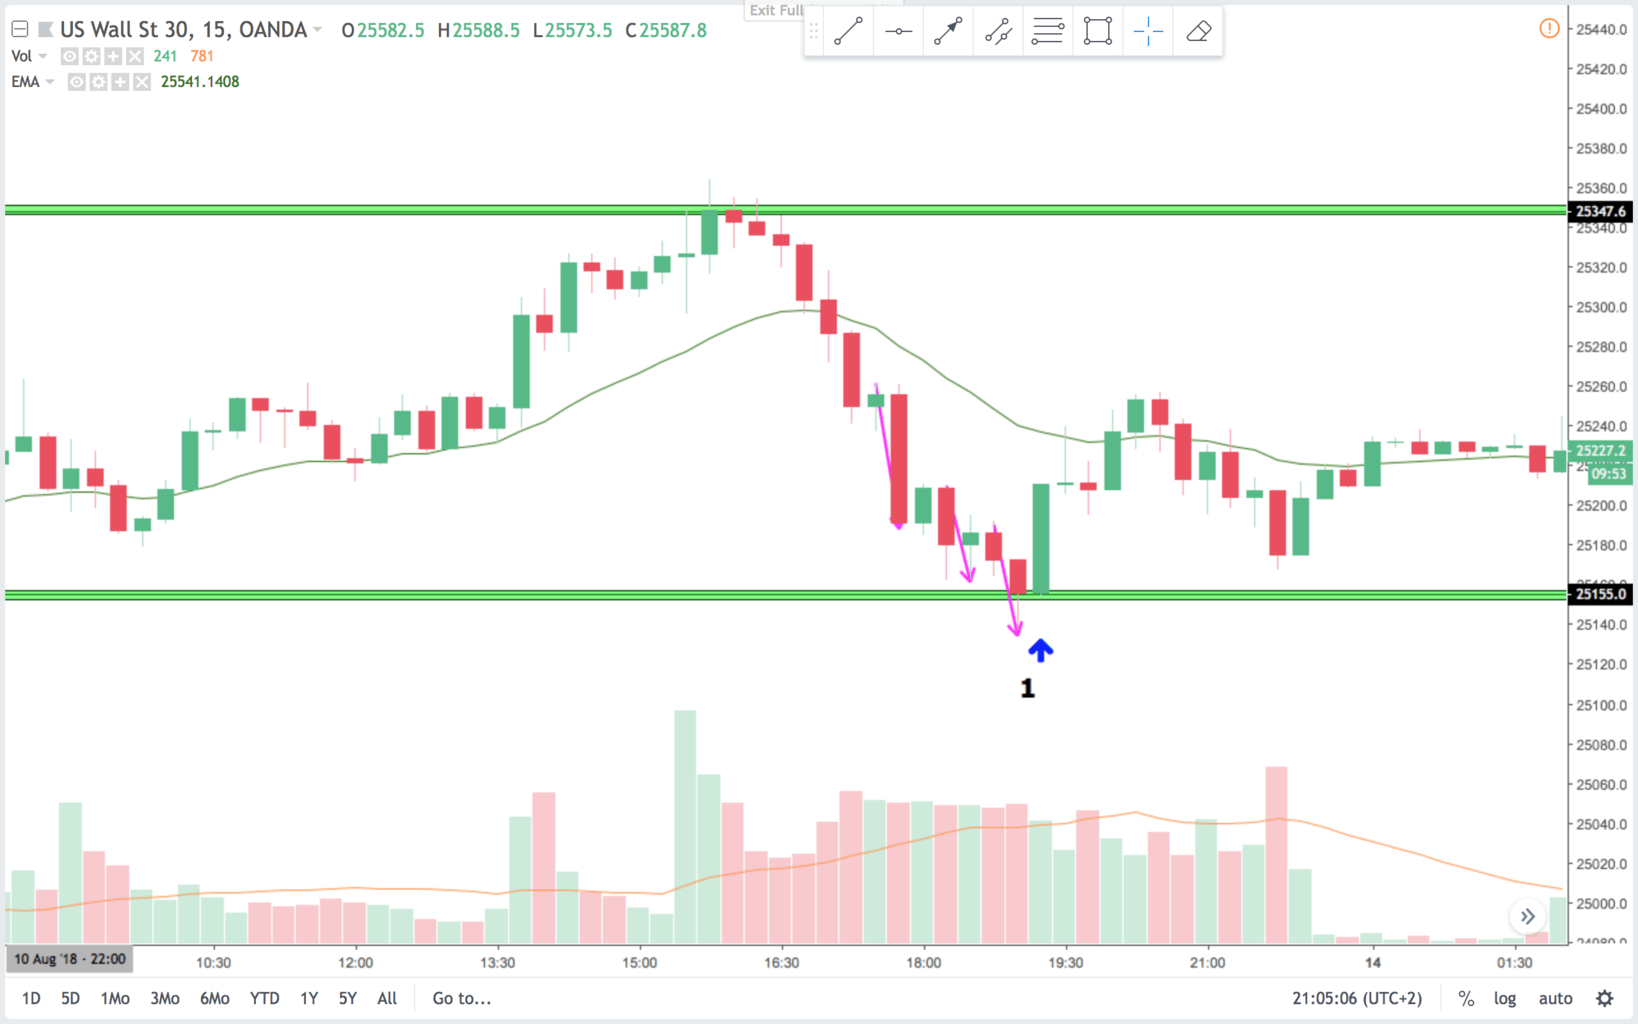
On the 15 min chart there is a spike and channel pattern. The channel took form as a three push pattern(three purple arrows). When a pattern like this ends on support and you get a good reversal bar- go for it. A pattern like this will reverse for at least two legs or 10 bars in 70-80% of the time. That is good probability in trading.
5 min chart:
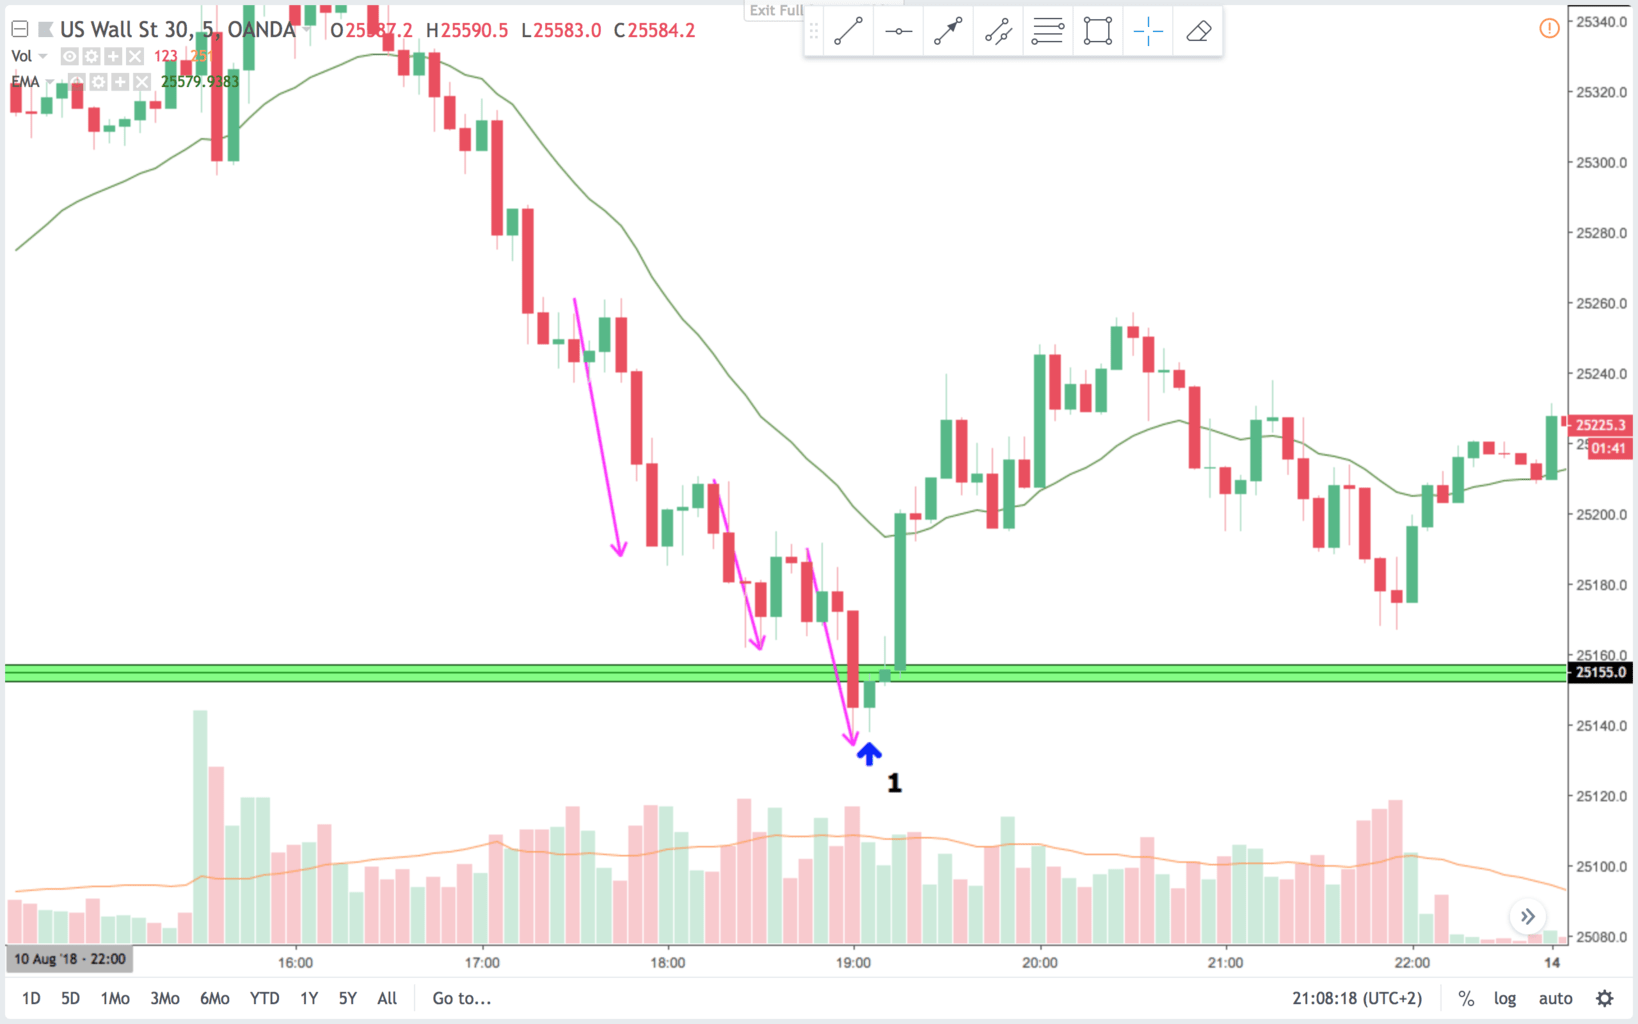
On the 5 min chart price bounced after a measured move and a three push pattern. It is a good trade because it is the completion of a pattern on a support line. It is also a scary trade. It is a strong bear sell off and you could wait for a higher low.
Trade 2:
15 min chart:
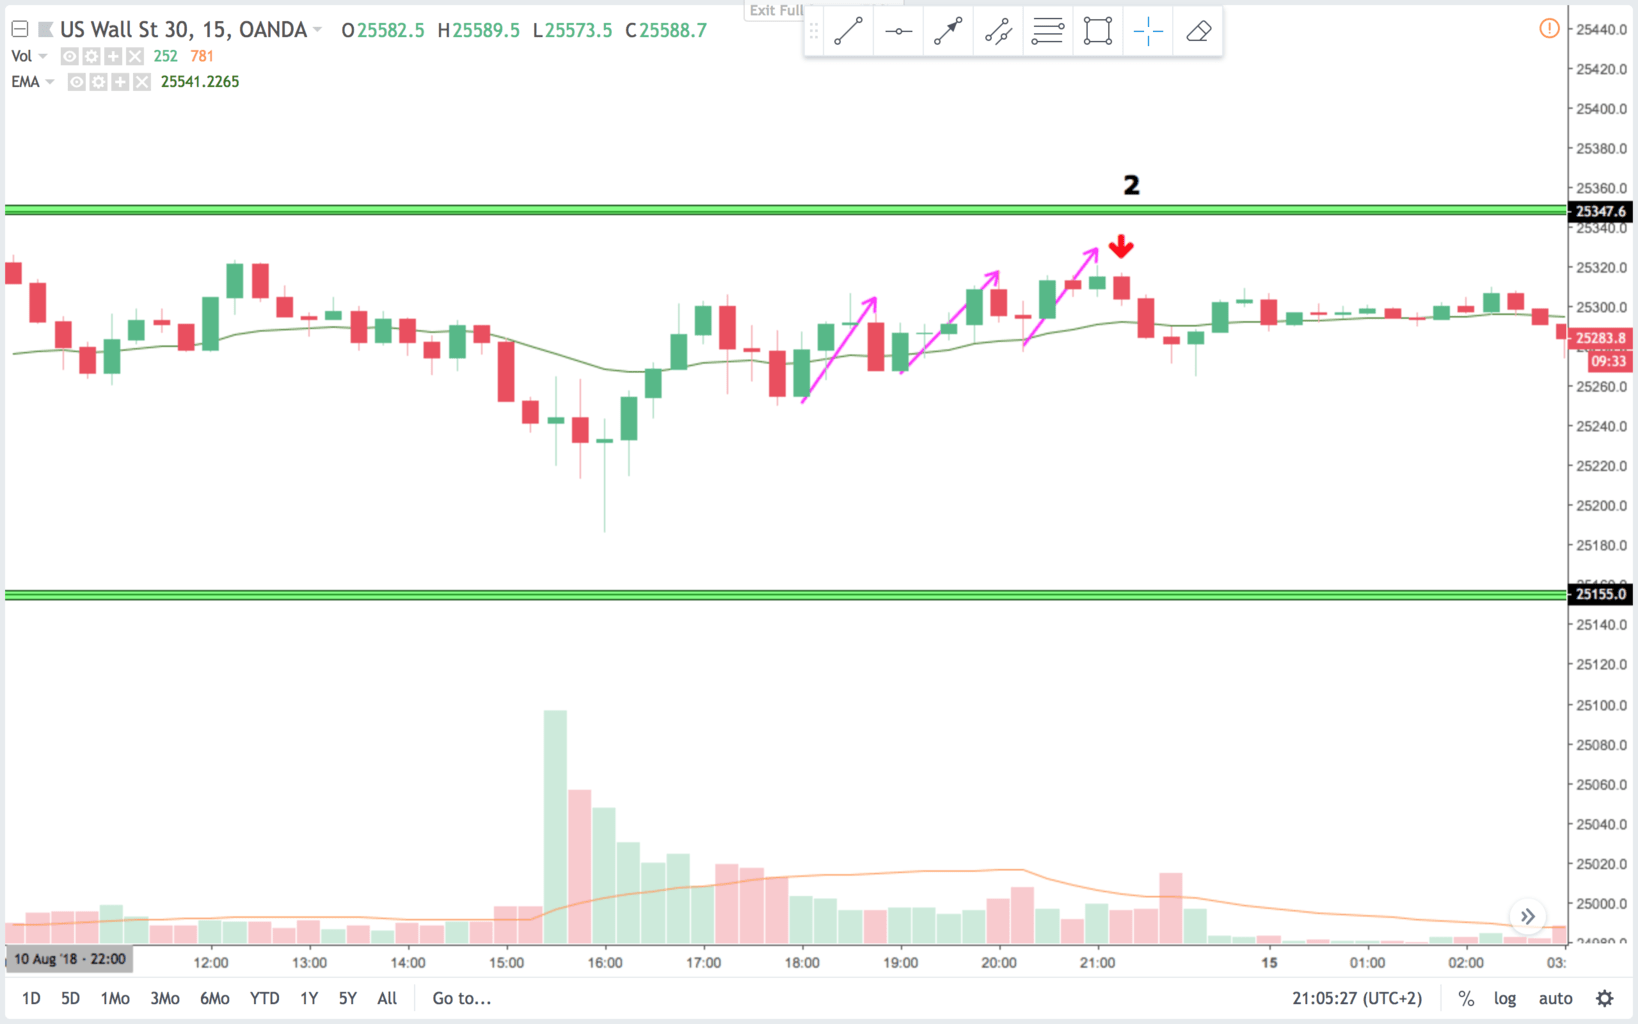
On the 15 min chart we see again a three push pattern. The initial bull leg was the spike, and that had a small pullback before the three pushes began. Then again a strong signal bar after a three push pattern is a good bet for the beginning of a correction.
5 min chart:
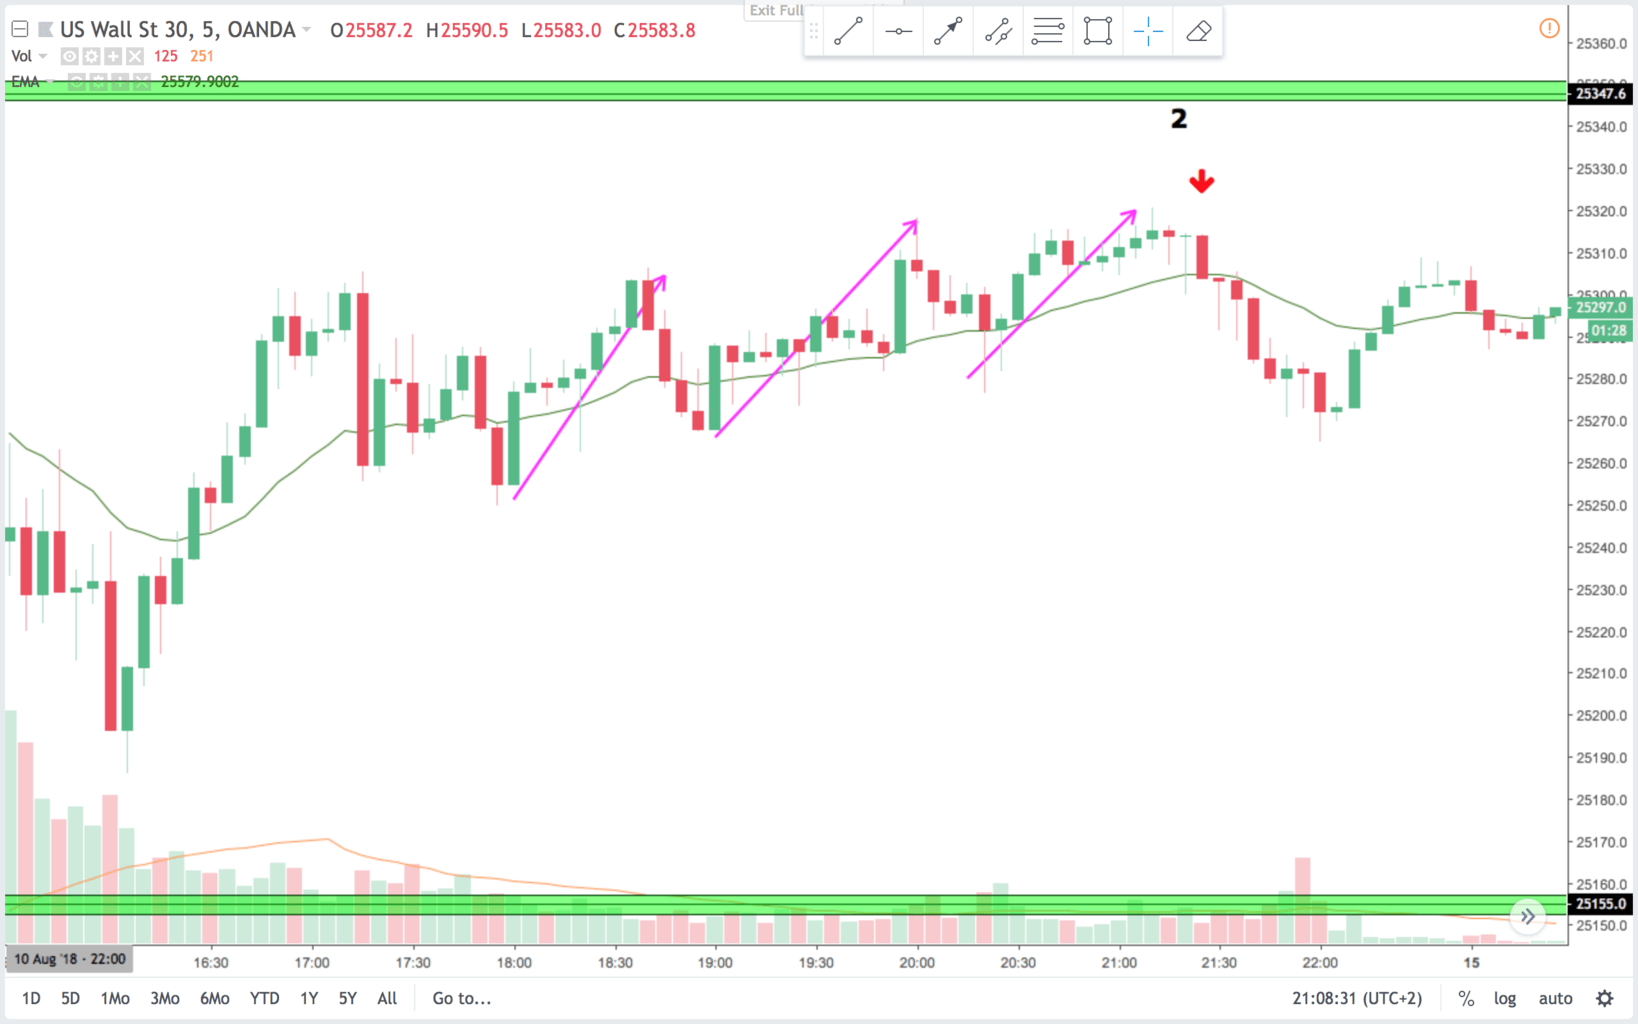
On the 5 min chart this is again a spike and channel pattern. The channel consists of a three push pattern. It never made it all the way to the resistance area but the signal bar was good and context as well. The channel was a weak bull channel with a lot of overlapping bars and deep pullbacks. The trade was late in the day, but profitable nonetheless.
Trade 3:
15 min chart:
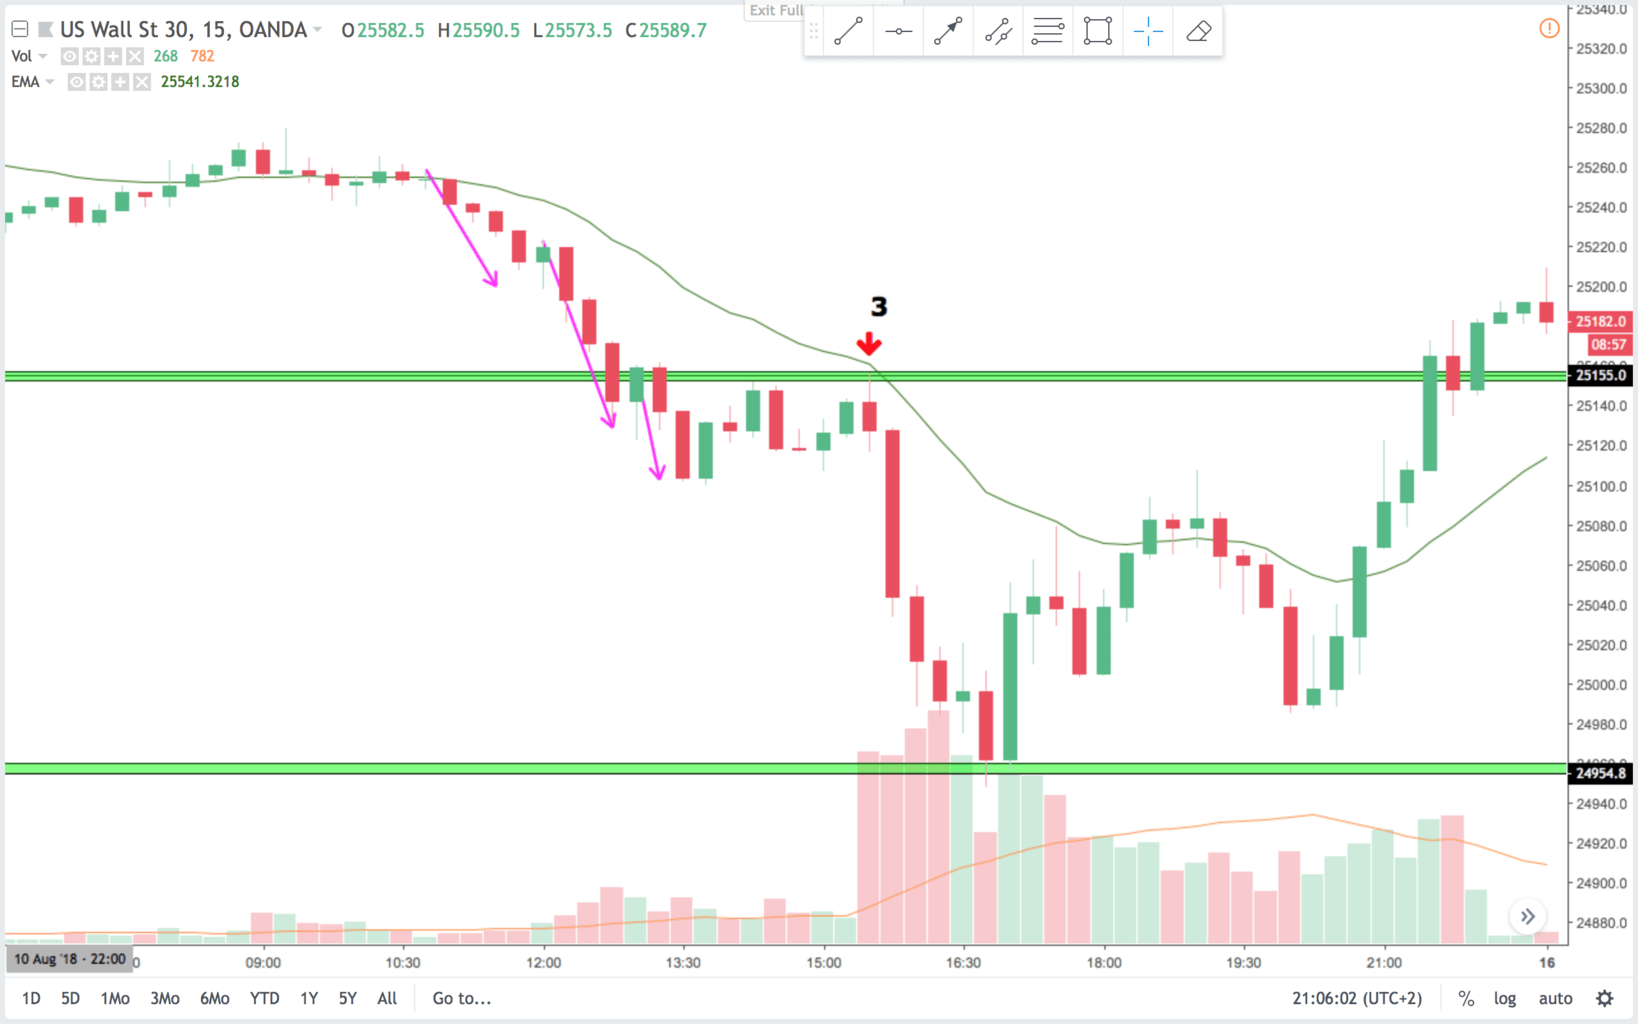
On the 15 min chart there was a small two legged correction after a three push pattern. The context was a BO below support and a pullback. The signal bar was at a double top and second entry short. Good context. But here the pullback after the three push pattern was not deep enough to get profits, and the context was bad. Context is before anything else in trading.
5 min chart:
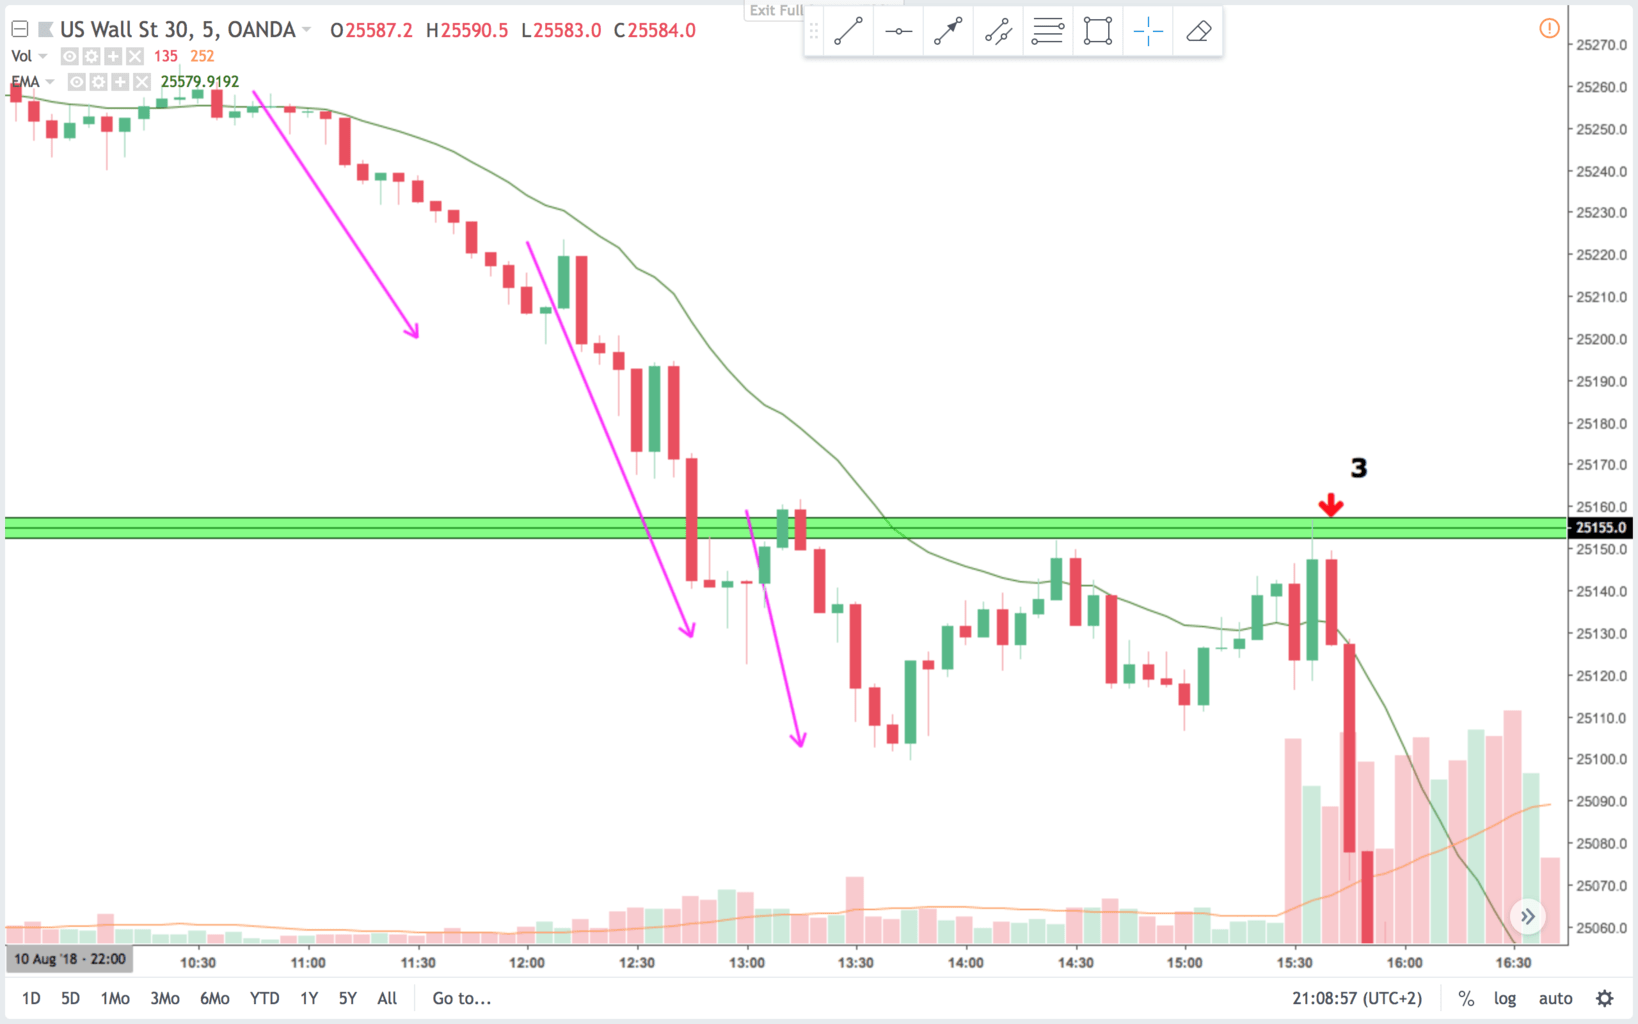
On the 5 min chart this is a trade in the open of the day. Price had a hard time to find its direction on the first two bars. The resistance area above favored a sell signal. So when price moved up and then down. The momentum was in the right direction in accordance to the context. The signal bar closed on the low, and I like to risk this on the open.
There are many different ways to count the three pushes. Often if you see it, then it is there. The trick is to trade it in the right context. The three push pattern is also known as a wedge pattern or three drives pattern. It is often nested in other patterns