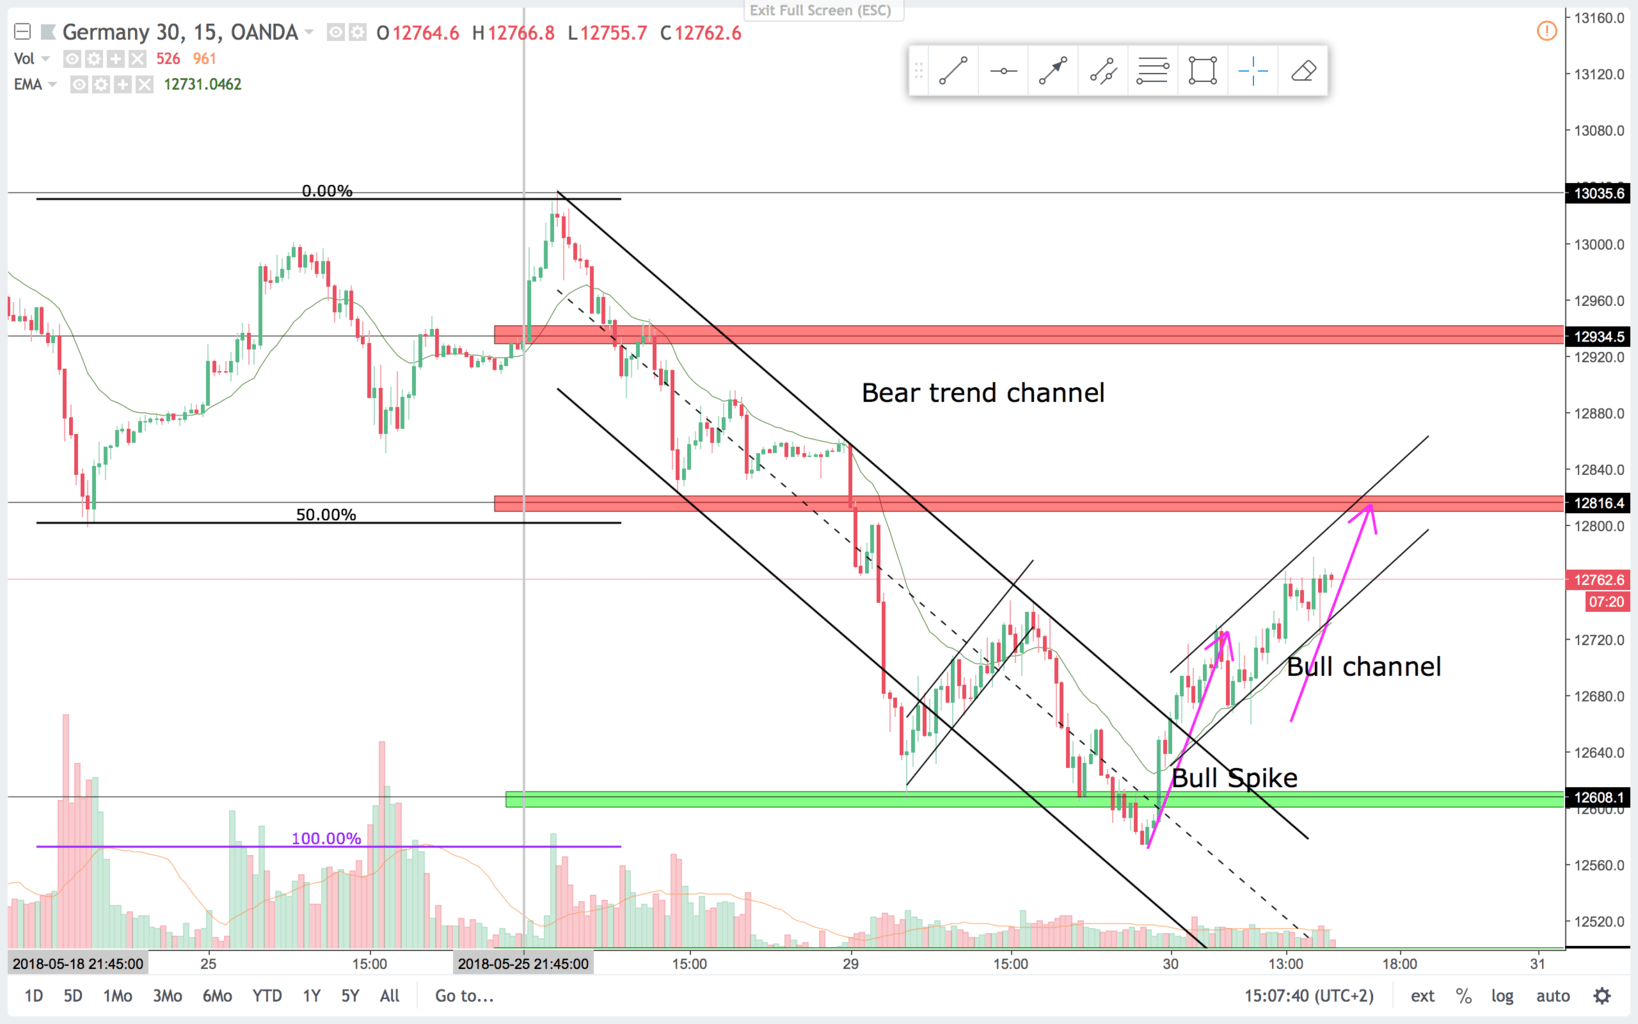
In the video on monday I talked about, how there was a higher probability of a breakout to the low side of last weeks trading range, since we traded down into the range. That held true as we got the break lower this week. A large three push pattern formed. The second push broke the channel line, and the third push missed the channel line. Then the trend line broke in a bull spike and channel pattern. There were a lot of money to be made on the short side this week as price from high to low is more than 600 points. And this is only monday and tuesdays trading. Price is now correcting on the selloff, and probably will trade up a bit more. Price probably will make another test of selling strength, and likely form a trading range. The bounce from the selloff came on a 100% expansion level and at major support, after a overshot of the channel line, which made the bounce predictable. On the 60 min time frame price is always in short. So look to swing shorts and scalp longs. It is not unlikely that 12.000 will be the magnet to the downside.
Trade 1:
15 min chart:
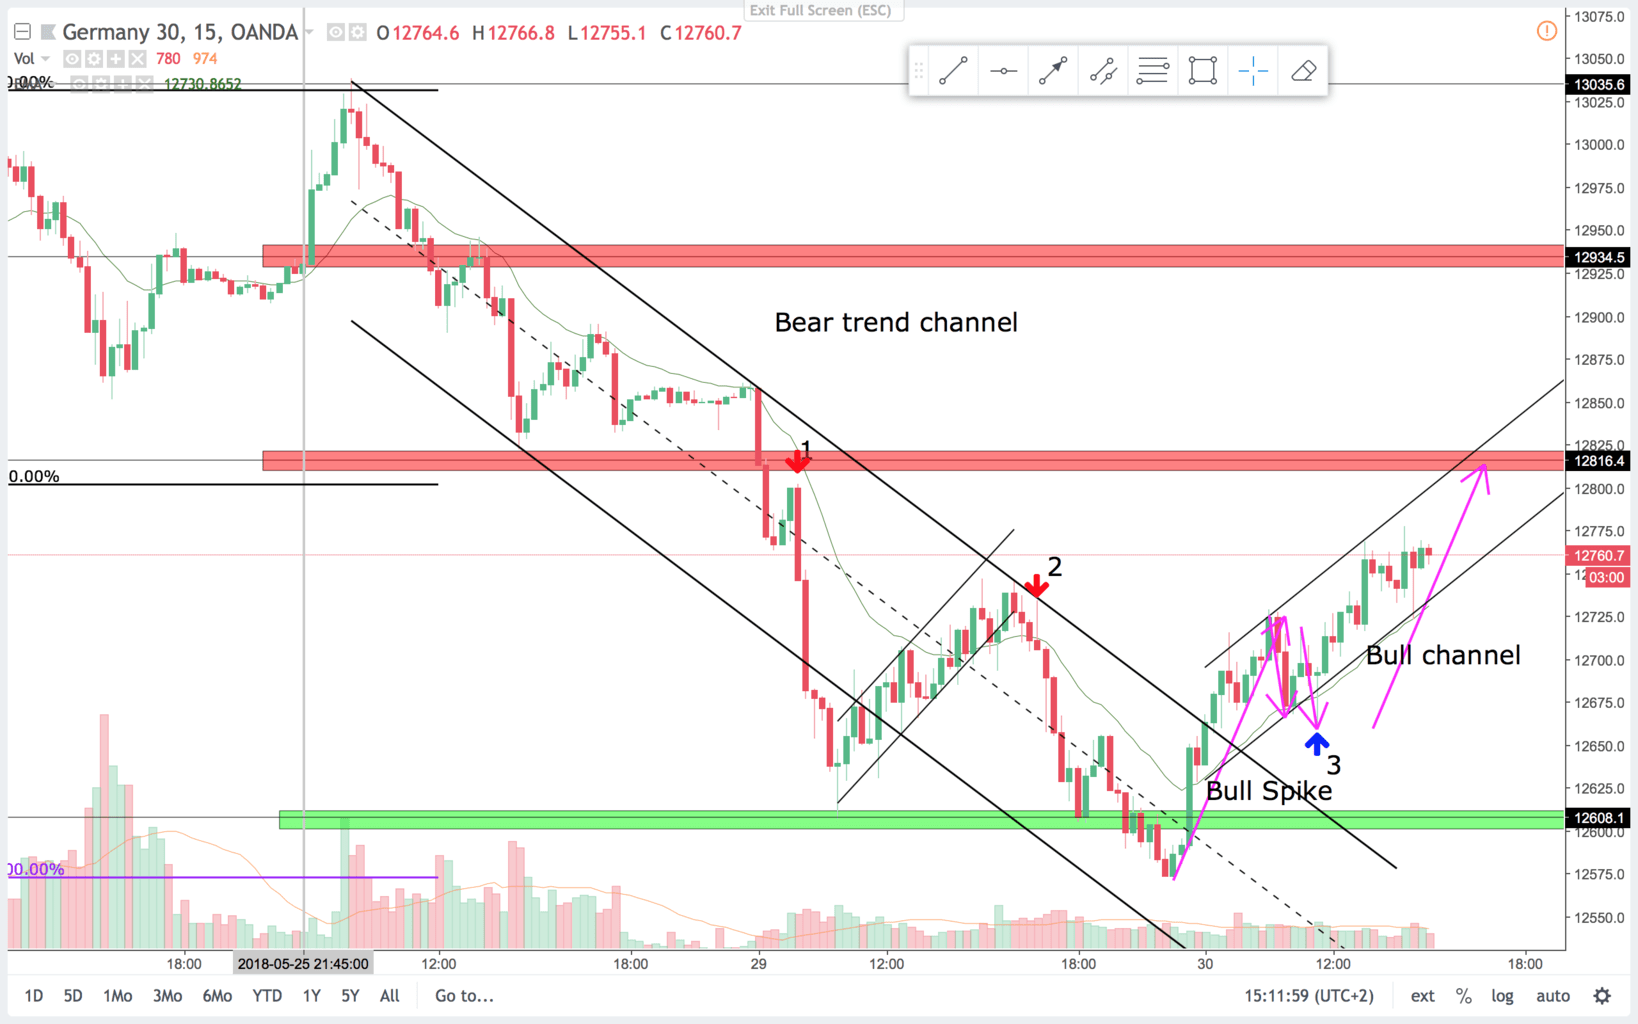
On the 15 min chart this is a first entry short in a breakout context. You could sell below the bull bar before the bear bar. Or wait for the bear bar to close and sell below it. It can be hard to sell on the low of the day, but then enter with a smaller position than usual and put you SL in the right place.
5 min chart:
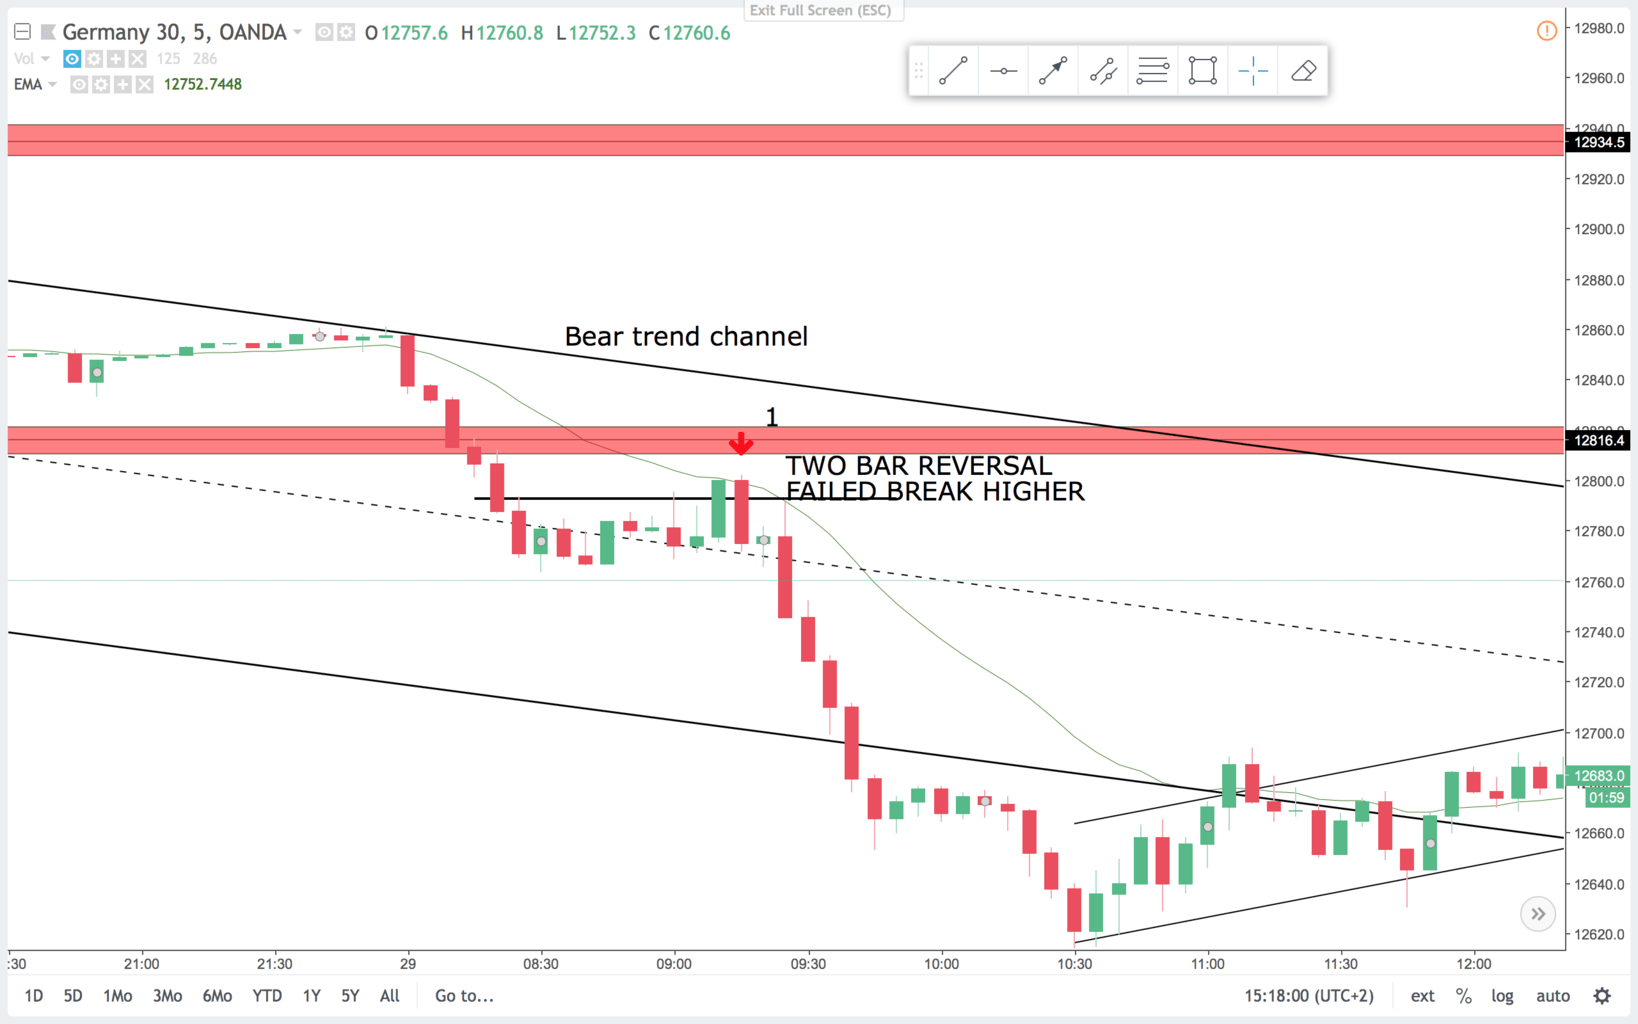
On the 5 min chart you get a nice two bar reversal. It is a breakout pullback sell signal after the break of the support above. It is a signal at the open and often the open is the high or low of the day. This signal was at a significant high not tested until two days later.
This was a good trade, and if you took profit on the support below you nettet 160 pips. This is the reason we keep runners.
Trade 2:
On the 15 min chart this is a minor head and shoulders pattern, or a double top lower high sell signal. It also reads like a failed second entry long. And the bear signal bar is very clear. I love to sell these corrections. Problem is, that after a break of the channel line you often get a break of the trend line. In this case, the brake came after a new low.
5 min chart:
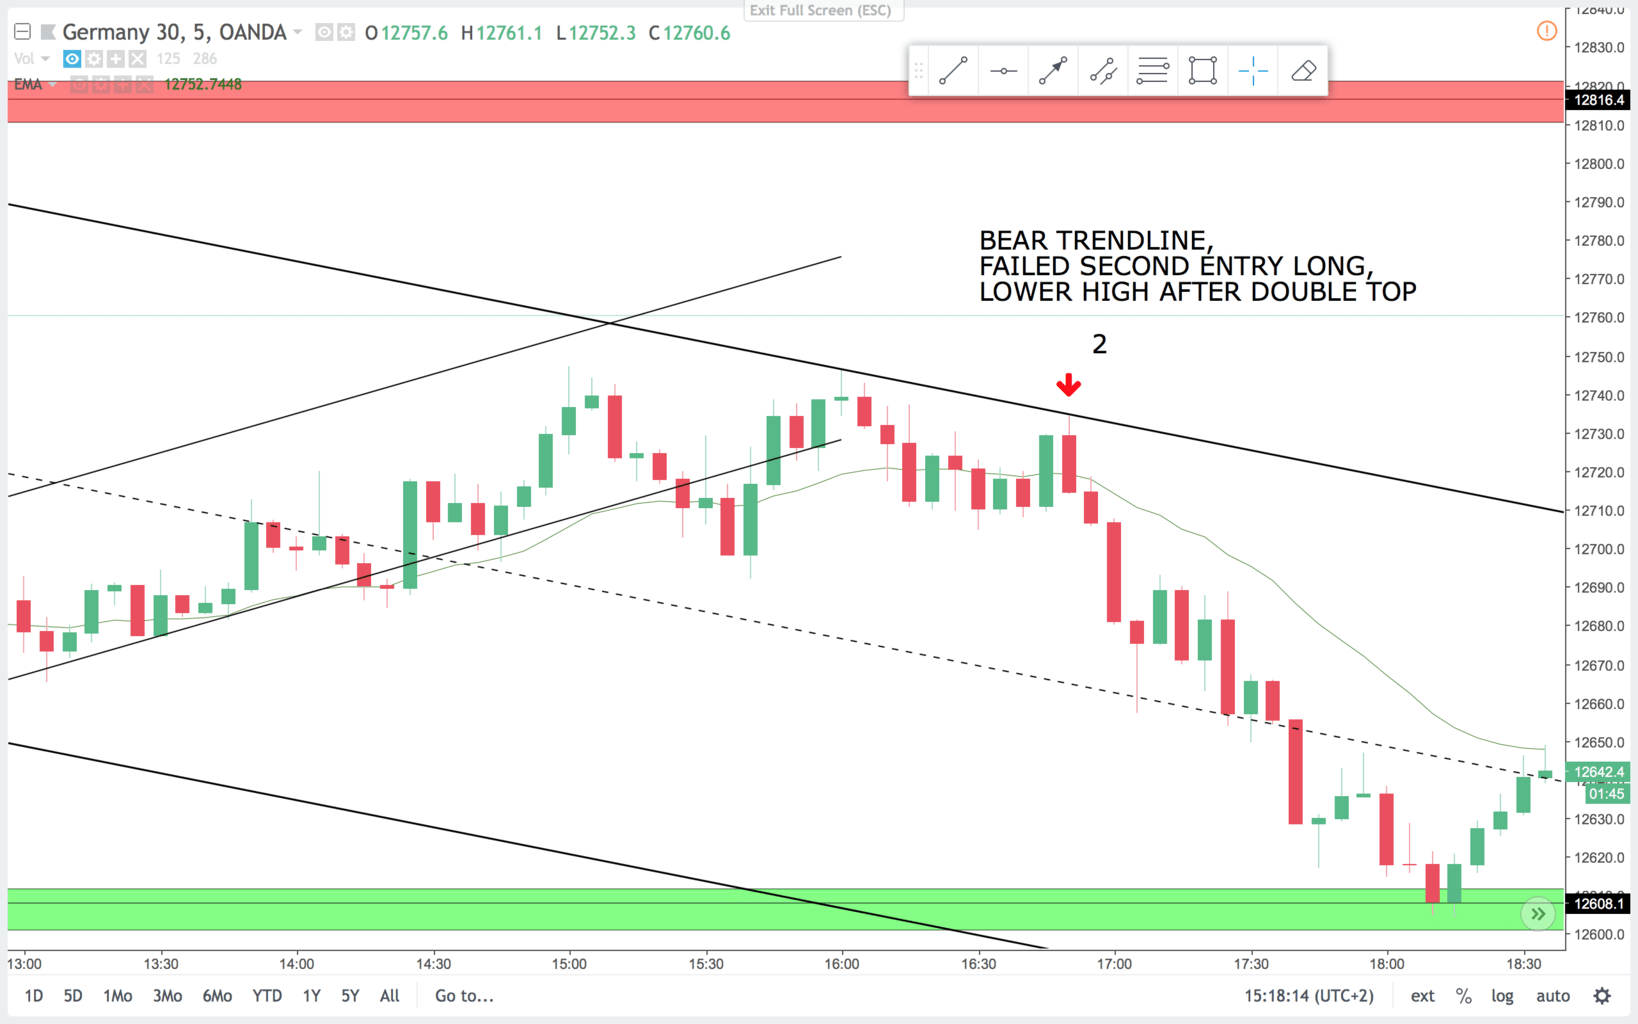
On the 5 min chart this is a hard trade. Price is trading sideways and that makes all signals and bar counting less probable. However this signal is a failed break higher, and a second test of the bear trendline after a double top. It is a lower high and I like to risk that. I would be careful if the bear sell signal fails. You could take a smaller position on more risky signals like this.
If you held the runners of this trade into the major support below as in trade 1 your runners nettet 100 pips.
Trade 3:
On the 15 min chart this is a second entry long. The signal bar is a bull bar that closed near the high after trading below the prior low. Price often moves a little below the prior low in these flag patterns taking out bull stops and trapping in break out selling bears. On the reversal bears cover their shorts and bulls re-enter their longs fueling the next leg up.
5 min chart:
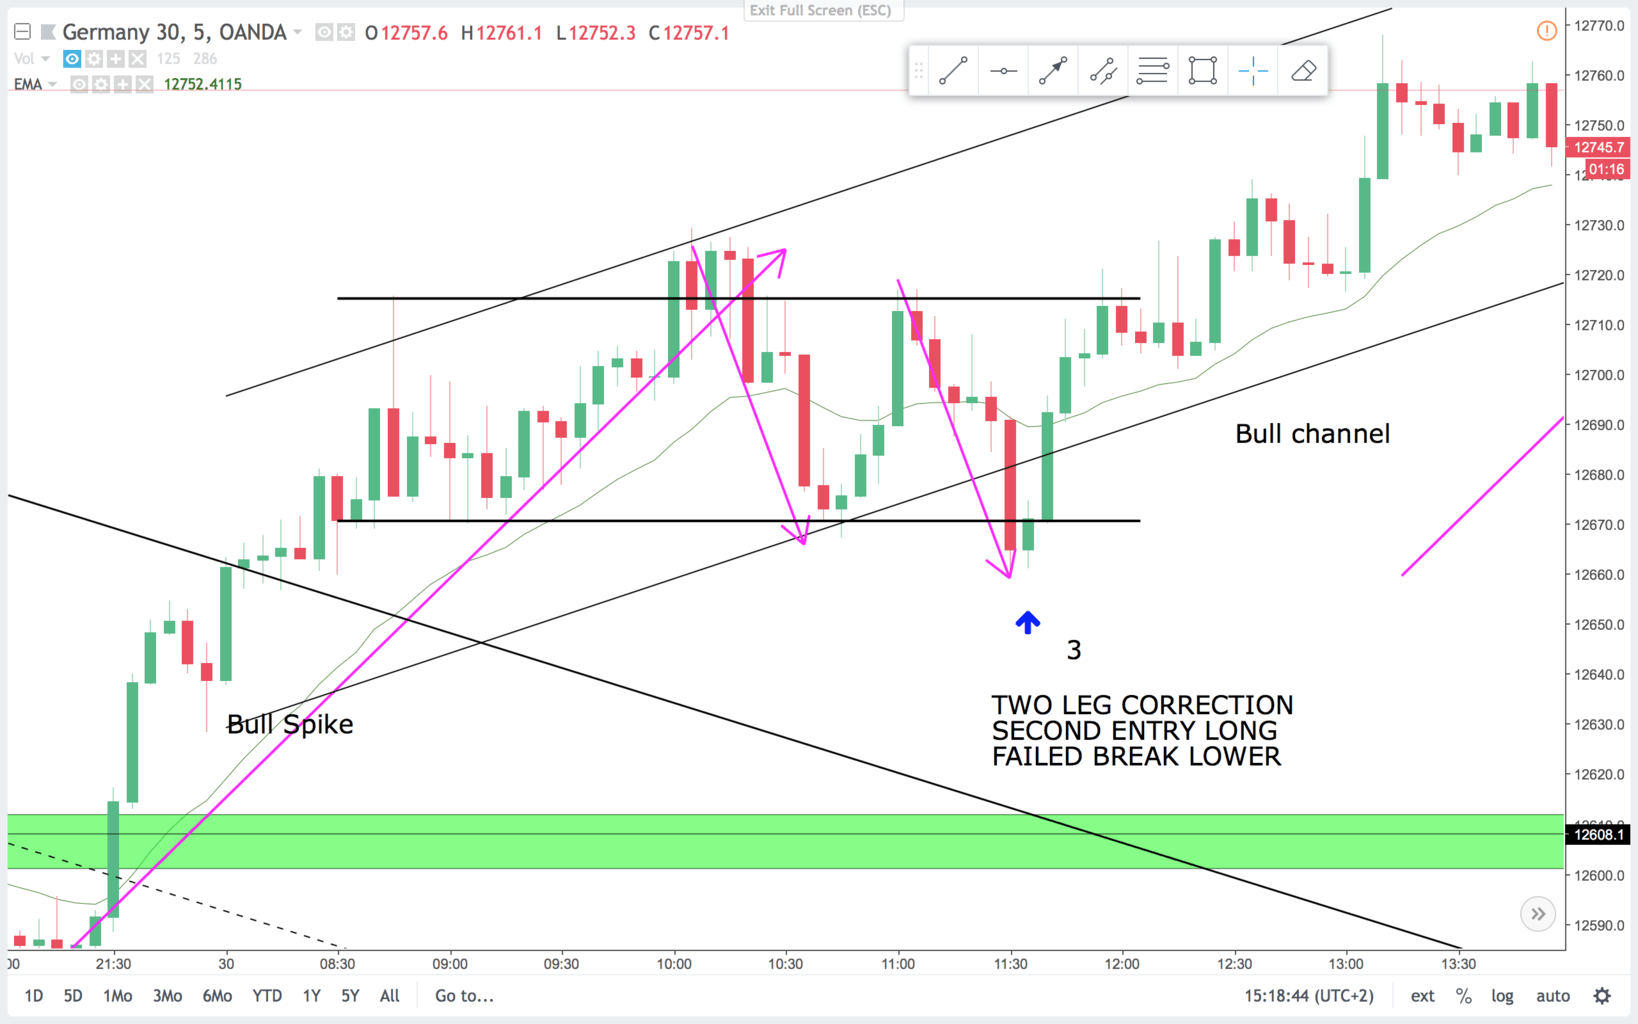
On the 5 min chart price is in a trading range. It made a measured leg down and a failed break below support. The signal bar is a bull bar that traded lower first then closed on the high. It is a small bar compared to the bear bar it followed. In a trading range- price often look like it is about to break out but it rarely does. After a failed breakout of a trading range you can expect an attempt to break out the other side.
So far this week we got a nice example of a reversal pattern. In a established channel look for a break of the channel or trend line. Then expect some sideways trading or a reversal. This is a classic reversal pattern.