15 min chart:

The Dow Jones is trading sideways after a sell off on Tuesday. Price formed a bear channel in the beginning of the week, then a 100% expansion followed by sideways trading. Price established a trading range(lower black range) and broke out to the upside. Then corrected on the bull BO with a bear channel(blue channel) A failed BO below the channel line fueled a bull push to a measured move up(Purple arrows). Probably more sideways the rest of the week.
Trade 1:
15 min chart:
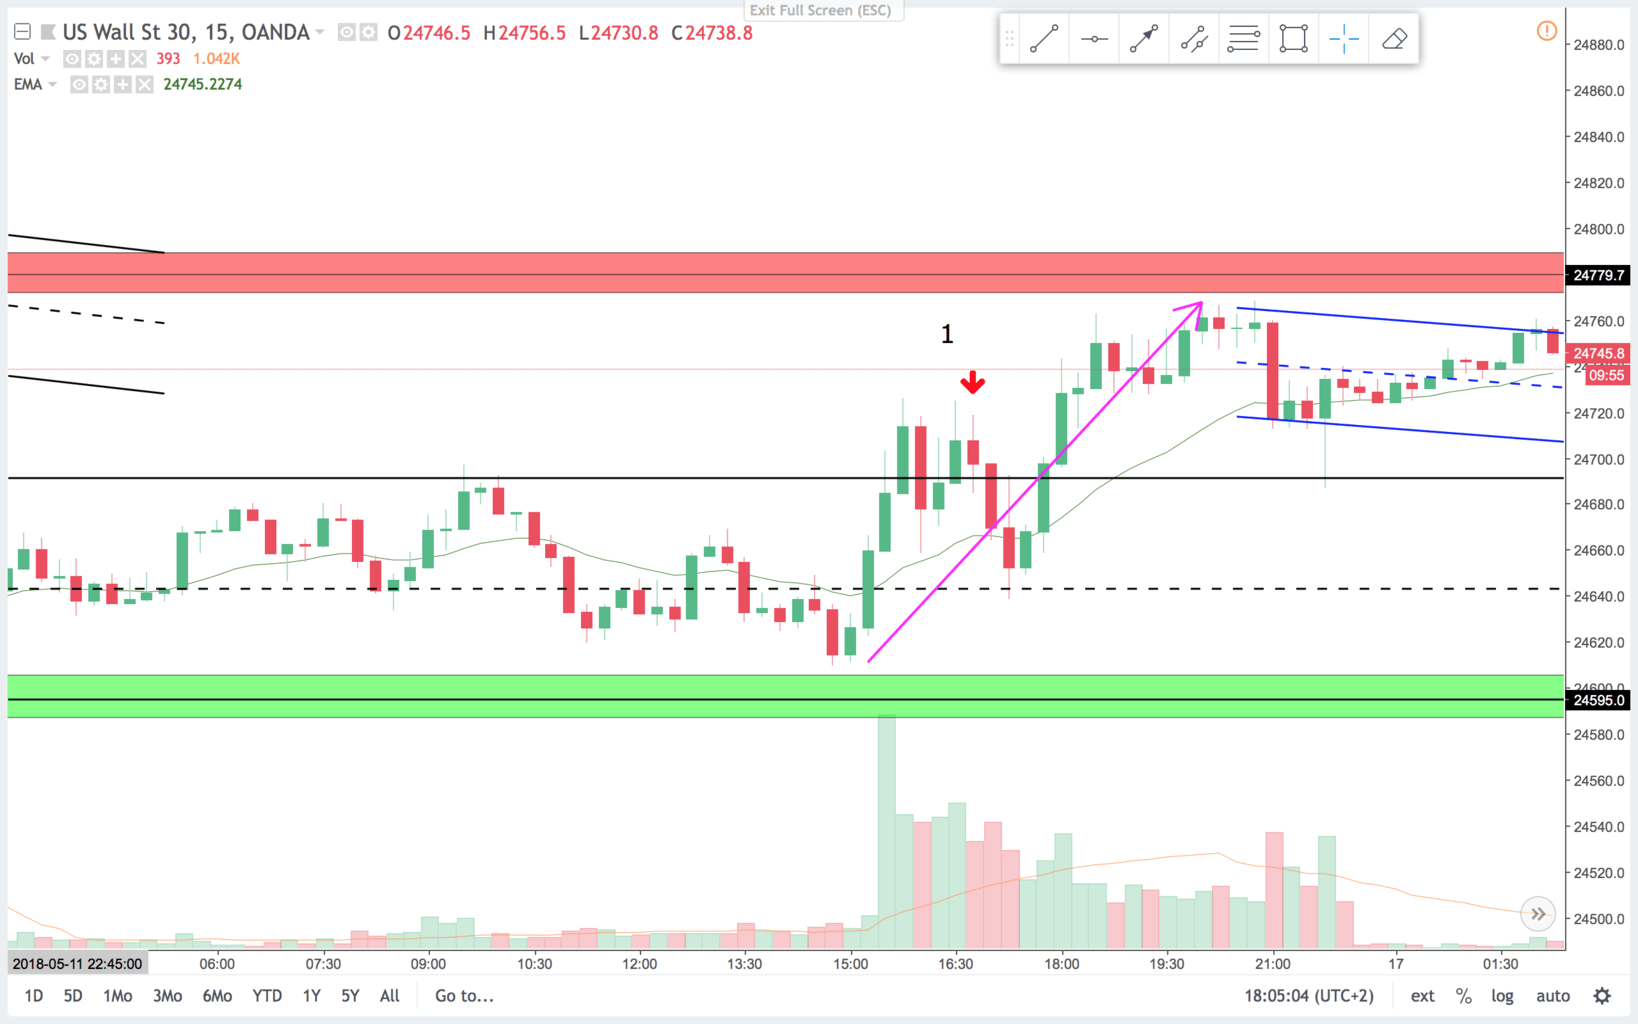
On the 15 min chart we had a established trading range(black range) Then price attempted to BO to the upside. Price made a double top on the BO attempt, I like this for a sell setup. Signal looked better on the 5 min.
5 min chart:
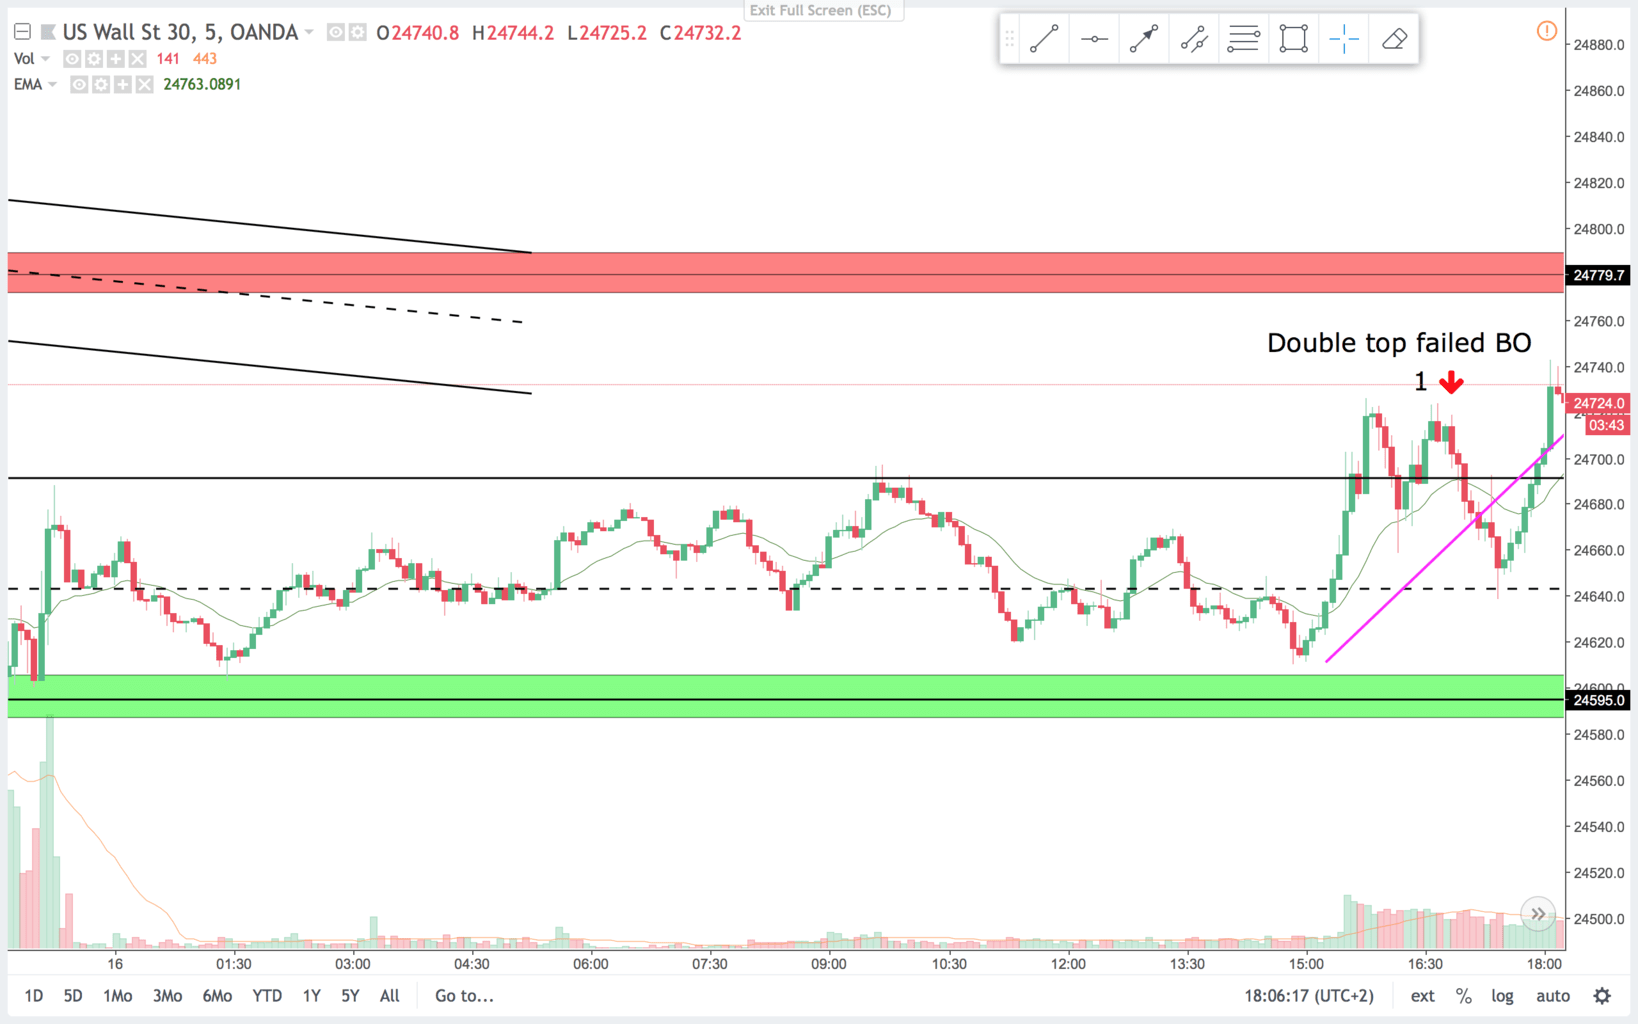
On the 5 min chart you clearly see the trading range and the BO attempt. Two ways to enter here. Enter below the bear bar two bars before the bear bar with the red arrow above. This is also a second entry sell signal. On the signal bar, we get a bear bar that traded above the bull bar before and then closed below. Strong sign that the bears are in control. Often on these tests of the extremes of a range, you get enough of a correction to get at least a scalp.
Trade 2:
15 min chart:
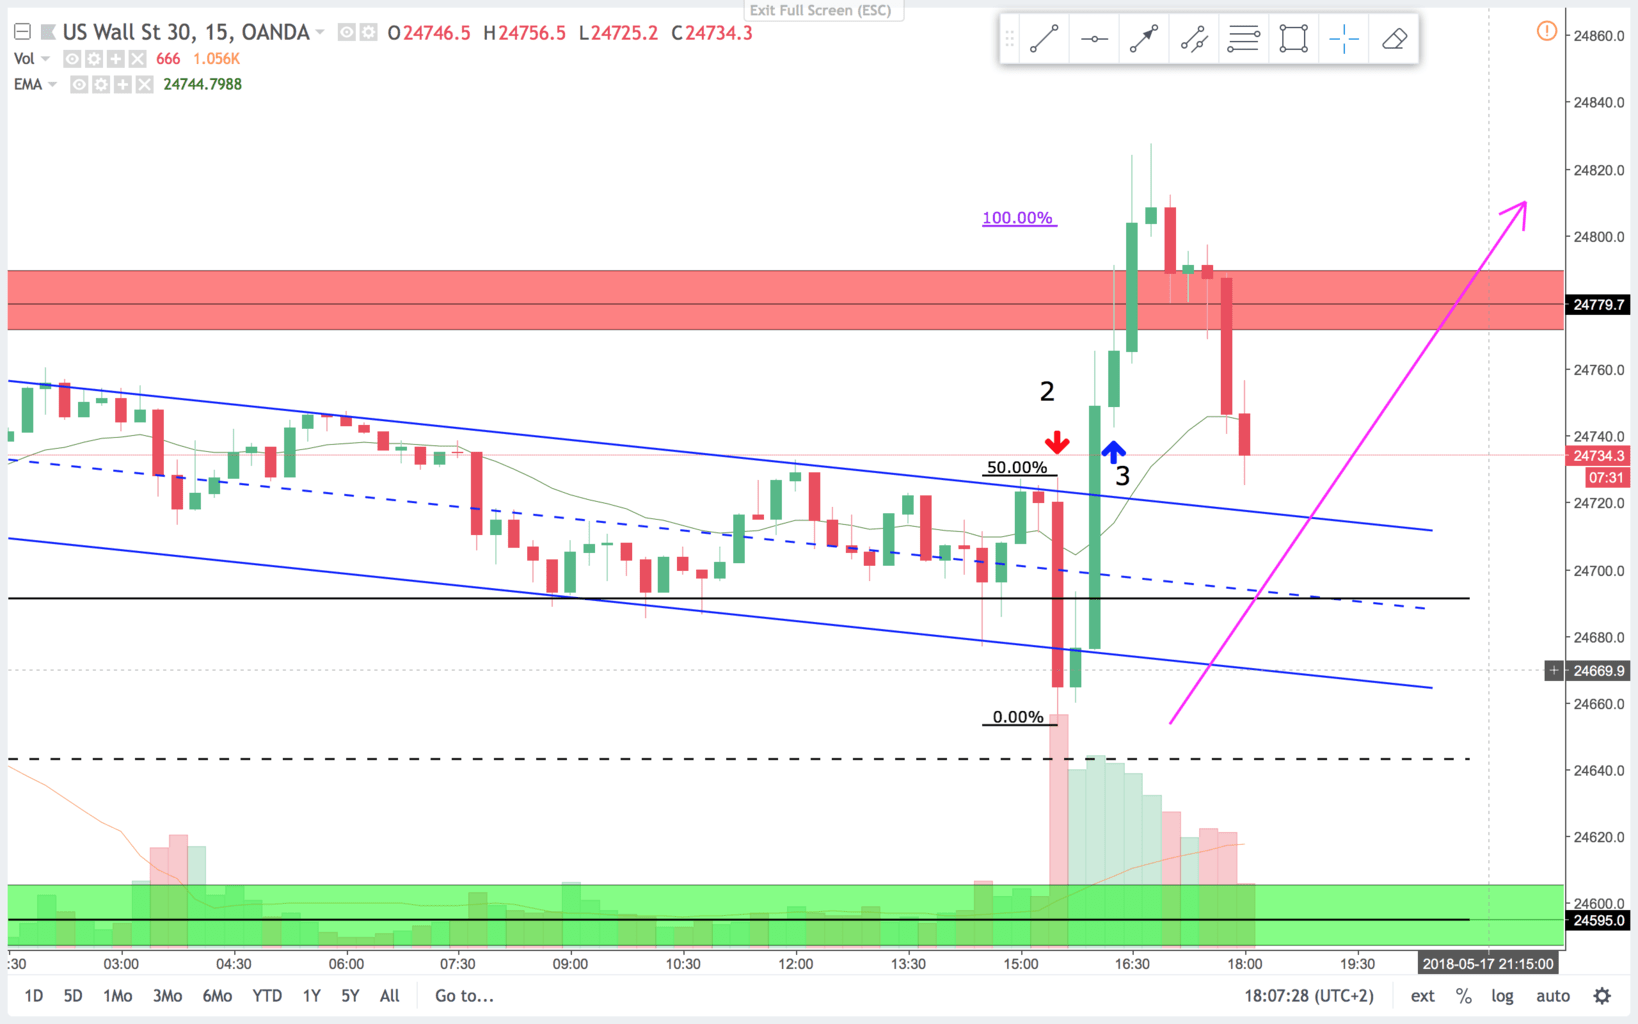
On the 15 min chart there is not really a setup. One could enter below the bear inside bar at the blue trendline. I like to see a better signal bar. And price never traded below open bear bar.
5 min chart:
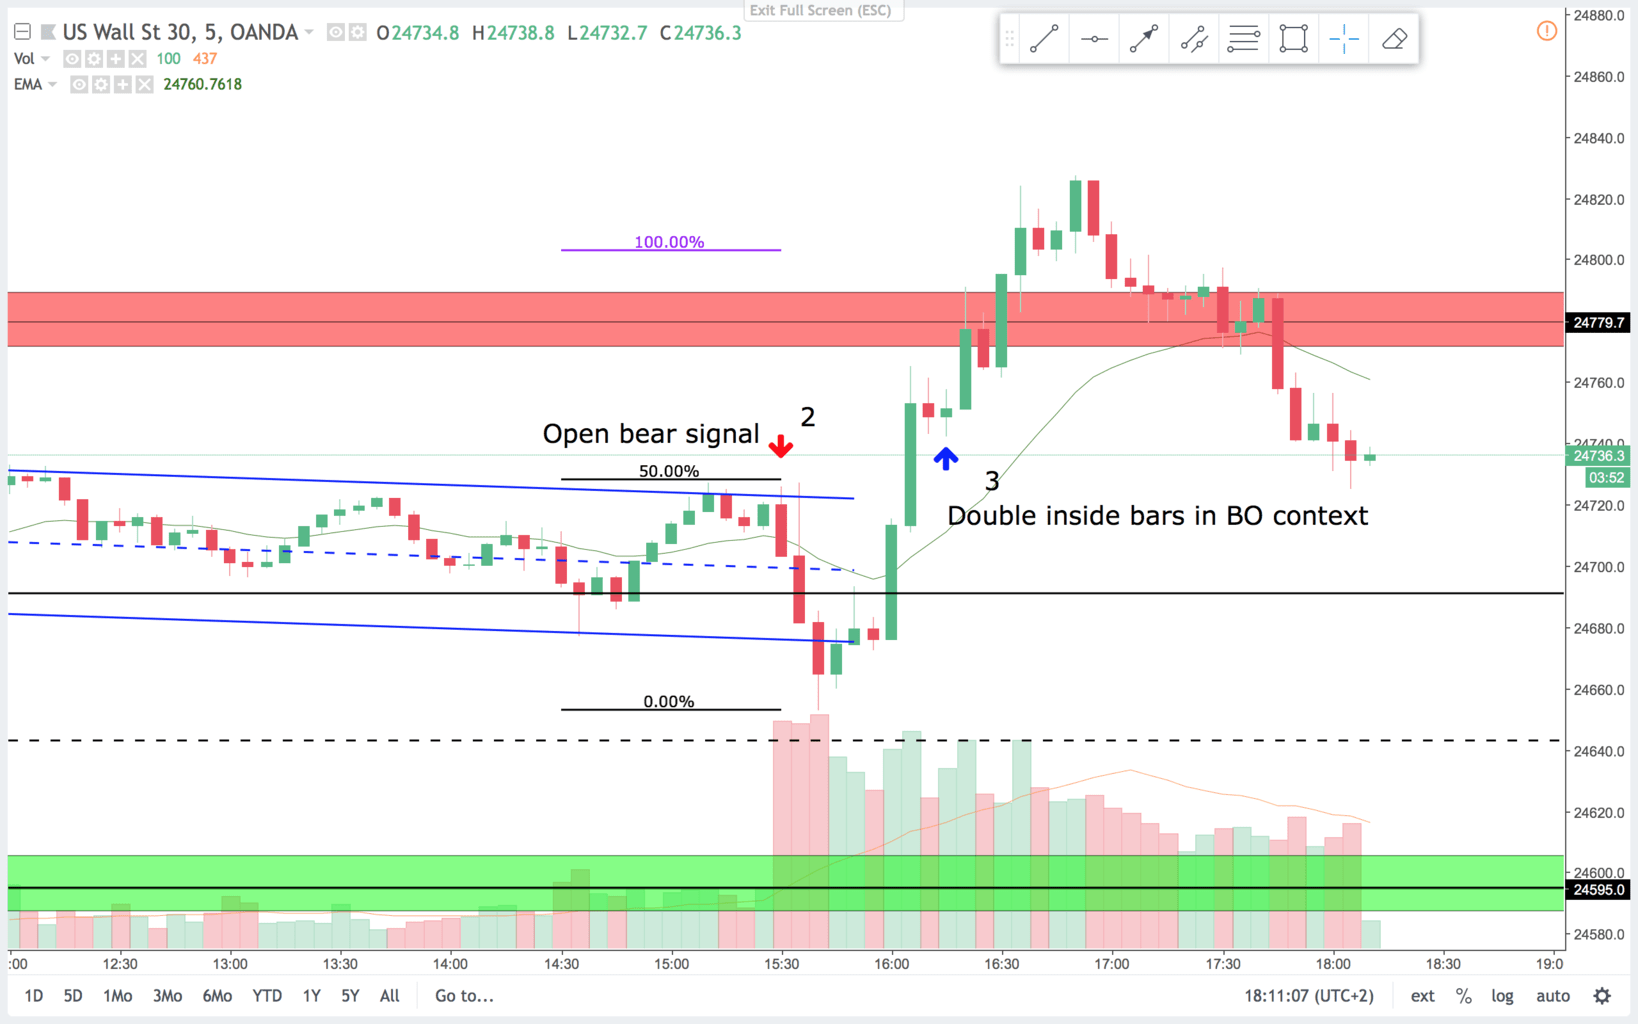
On the 5 min chart the open bar is a bear bar that closed on the low. I like to enter below that on the open to get a scalp- or a from the open trend day. The bar that followed traded one point above the open bar. I usually put my SL 3-4 points above the high just in case this happens. If you were stopped out, you could re-enter when it dropped below the open bar again.
Trade 3:
On the 15 min chart you do not get a signal here. But notice the large bear bar that canceled the open bear. That is a sign of at least a bit higher prices. Price reached a 100% expansion to the upside, and then some. Nice bounce on the resistance area(red area) even though it went a bit higher.
On the 5 min chart you see the low of the day was a open reversal after a failed BO below the blue channel line. There was no really good buy setup at the low. Then you got the two really strong bull bars that closed at or near the highs. both bars was bought from the close of the previous bar. This is a strong bull sign. The setup is two inside bars. Both bars are inside the large bull bar. And in a BO context like this you get a nice probability of follow through in the BO direction. This first entry turned out to be the first low in a three push pattern and a steep spike and channel pattern.
In these sideways markets I do not like keeping runners to long. I keep taking off half of my runners as they meet resistance and move my stop closer. More often than not your break even stops are taken out at some point. Be aware of this and manage appropriately. Also consider taking full profits and not keeping runners.