Hi traders,
This week (shown on the 15 min chart below) so far has been a bear week. Lower lows and lower highs. I moved a couple of the support and resistance lines to fit with the latest price action. Again this week we got an example of the channel line break that lead to trendline breaks. Look at the volume on the 14. This was a climatic push into support and a third push down. This is also known as a selling climax. It broke the channel line and made a nice double bottom. The following corrections was larger than the ones that followed the previous lows. That increases the probability that the bear trend will get a larger correction sideways to up.
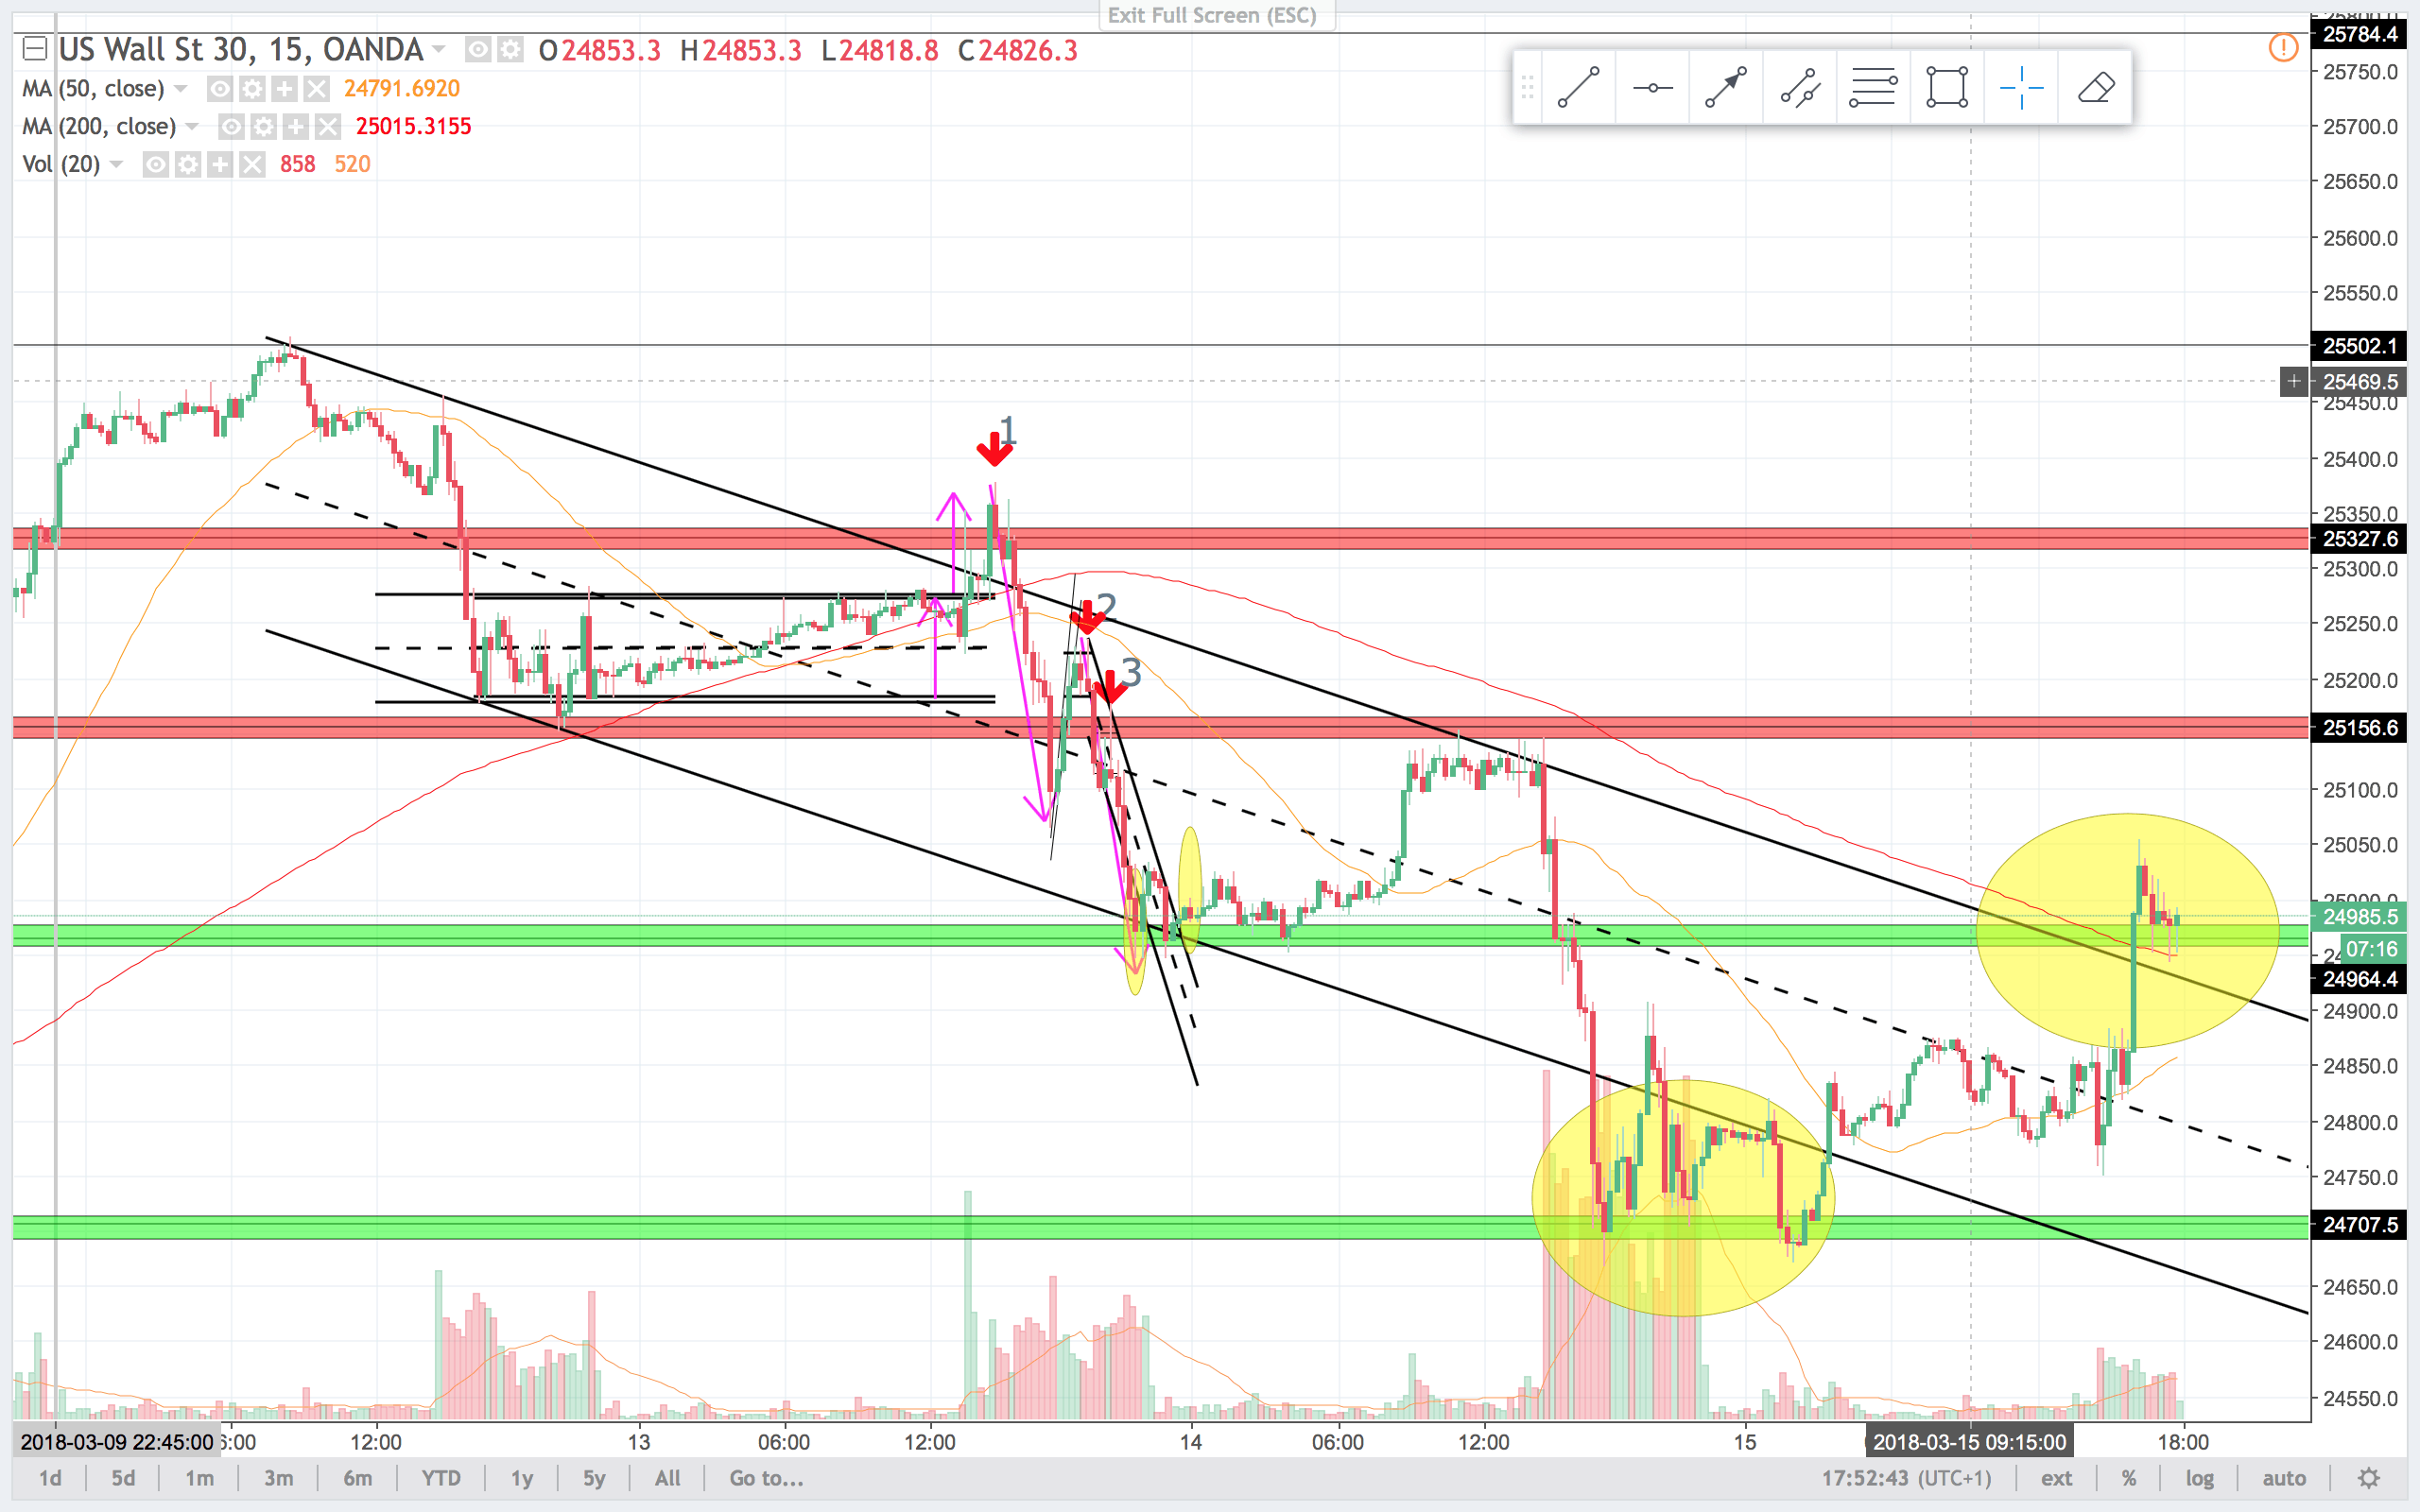
1
On the 15 min chart the 1 trade is a clear equal distance push out of the trading-range. The two purple arrows pointing up illustrates this. That is also known as a 100% expansion of the trading-range.
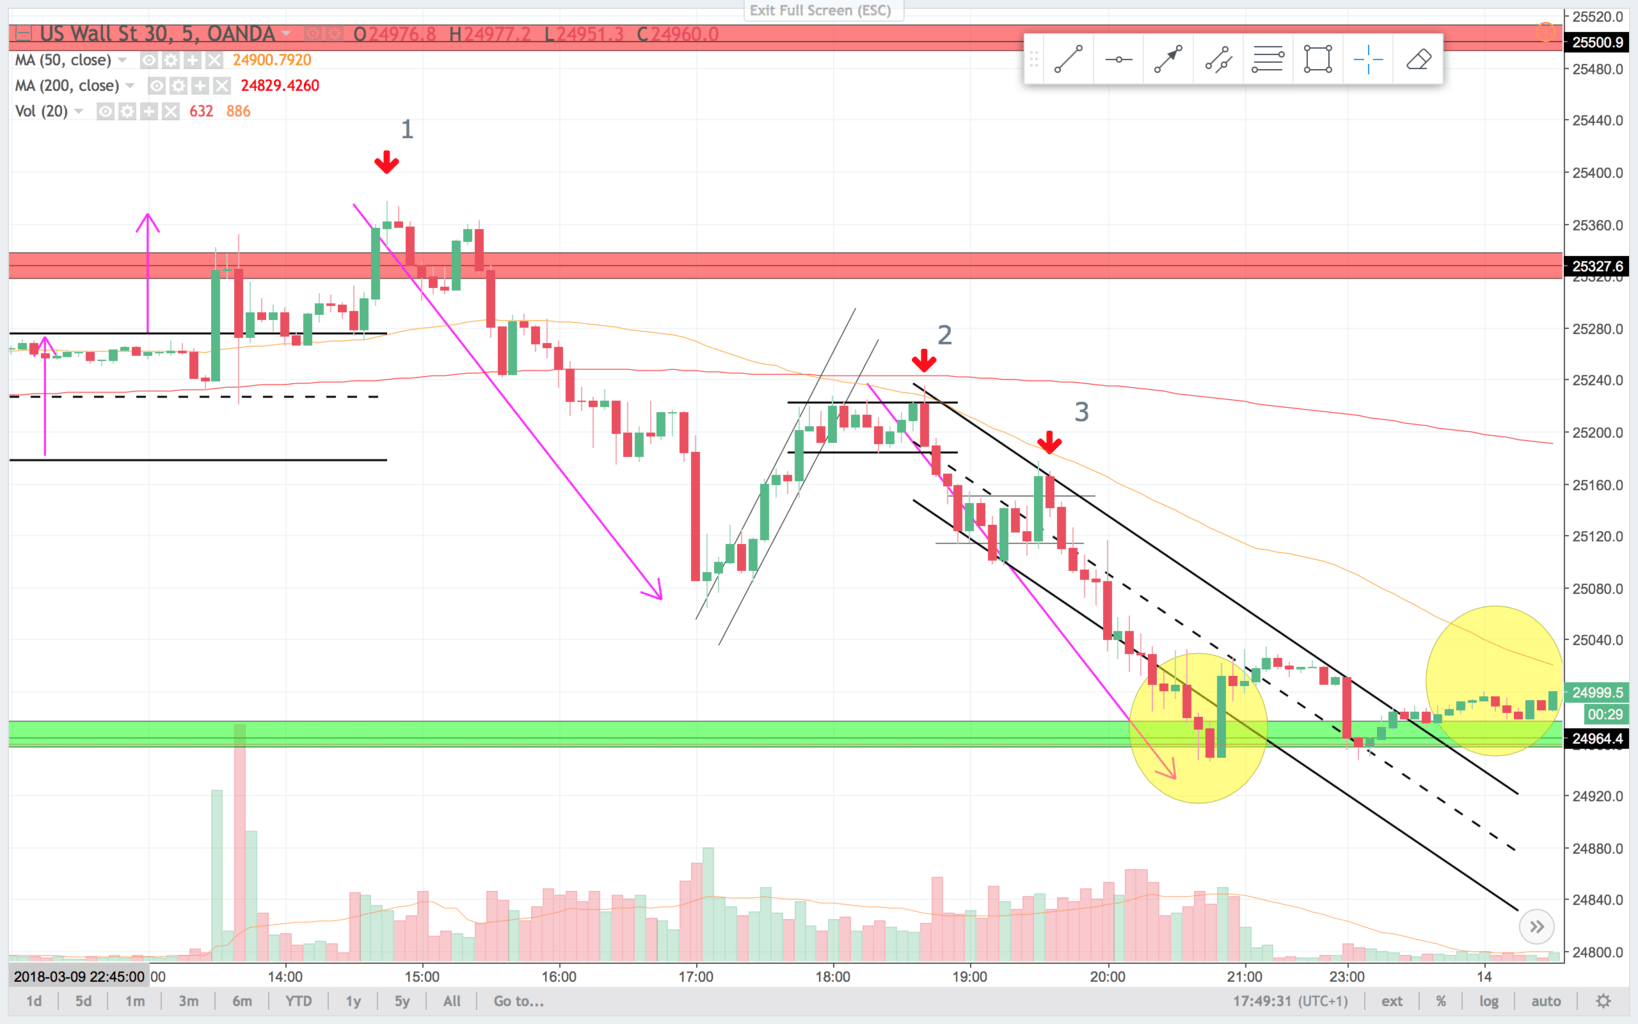
On the 5 min chart it is easy to see the measured distance move. There is a initial short signal on the inside bear bar below the arrow. I like it even better at the lower high about 30 min later.
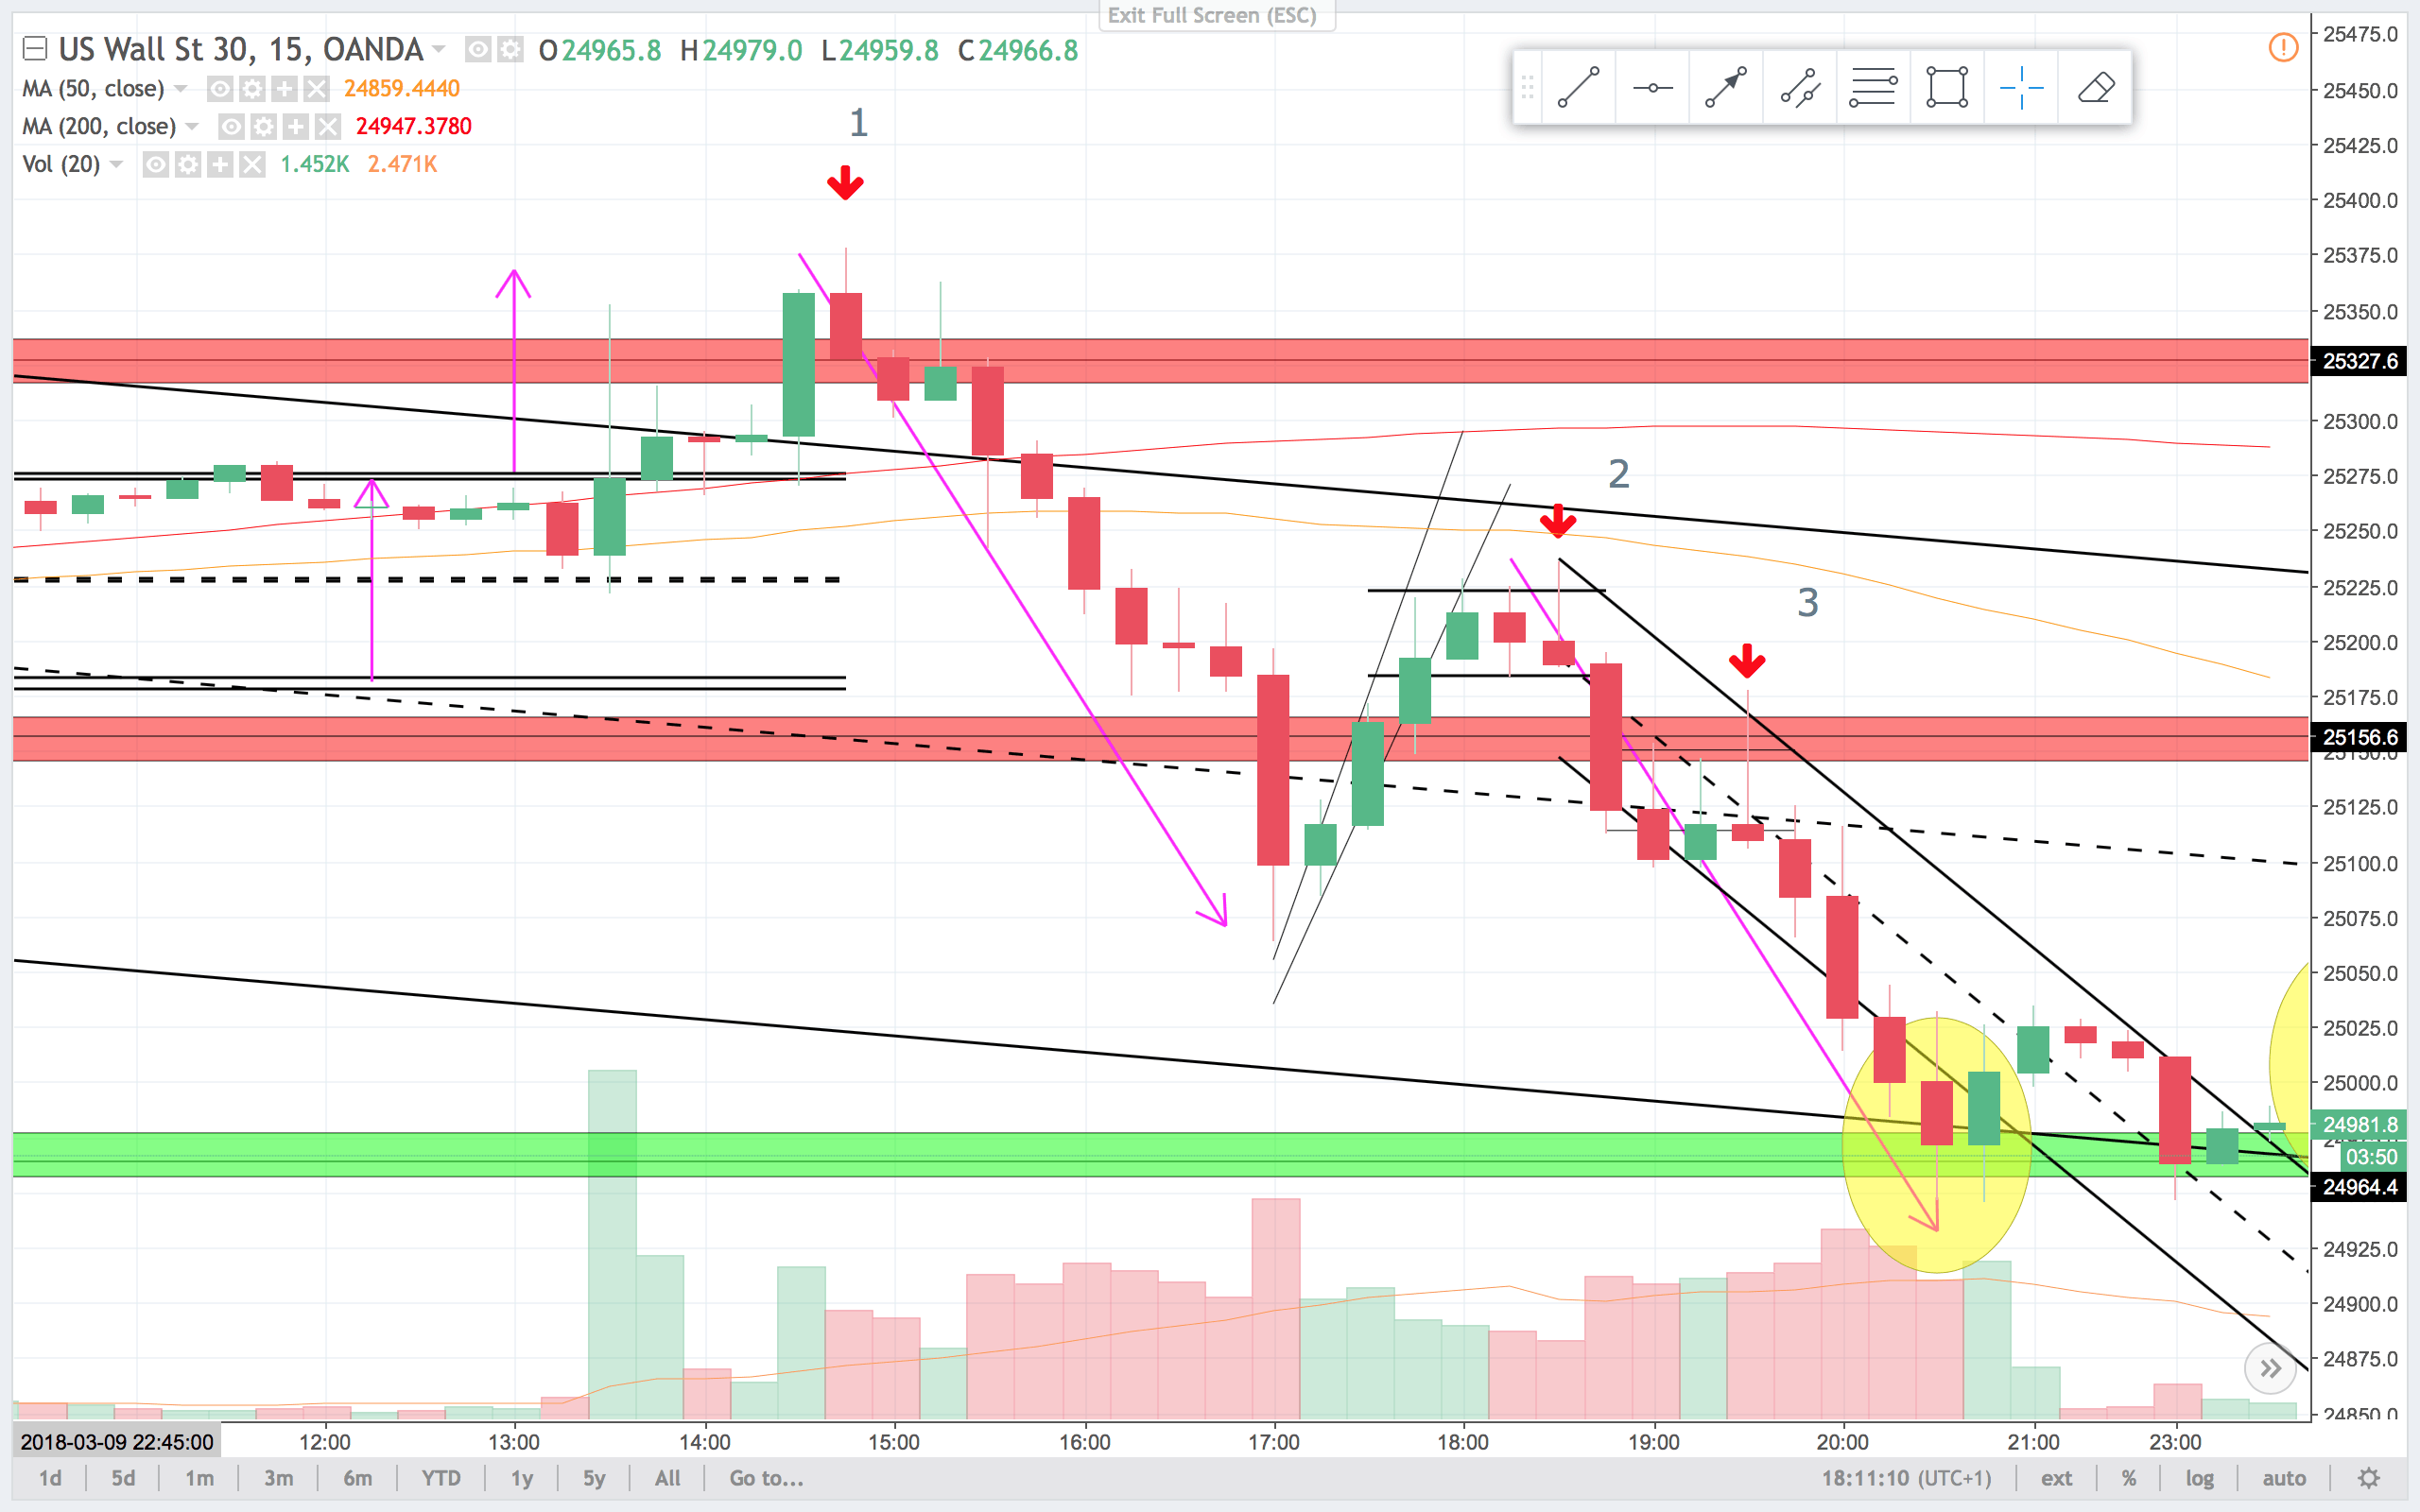
2
On the 15 min chart, this is a breakout pullback sell signal. It is not easy to see, but it is a second entry short. When the signal bar push higher and then closes on the low I like that for a retest of the lows, or a measured move down.
On the 5 min chart this is a double top and a failed break higher that closes on the low. This is a pattern often seen in breakout pullback setups. Also notice the thin bull channel up was broken and then the highs was tested on the signal bar. Nice setup after the strong bear move in the beginning of the day.
3
On the 15 min chart, this is a lower high and the fact, that the bulls had pushed price all the way to the top of the tail, and then into the end of the bar, bears sold it to a close on the low showed me, that bears still was in control, and I like to risk that for a measured move (the purple arrows are equal distance).
On the 5 min chart, this is a small second entry short. Every bull bar is sold on the close, bears are clearly in control of the market. Probably the buyers is only sellers taking profits. I like to risk this for a re-test of 25.080 or lower.
At the end of the bear leg on the 5 min chart we see a familiar pattern. The channel line was broken into support, and then price starts to move sideways and broke the trendline opposite. There is a lot of money to be made in these moves. Swing some of the position in direction of the trend. I use the moving averages to remind me of the trend. I like to take some profits and keep runners on the position. Depending on my confidence in the trend, I adjust my profit taking and runners.