15 min chart:
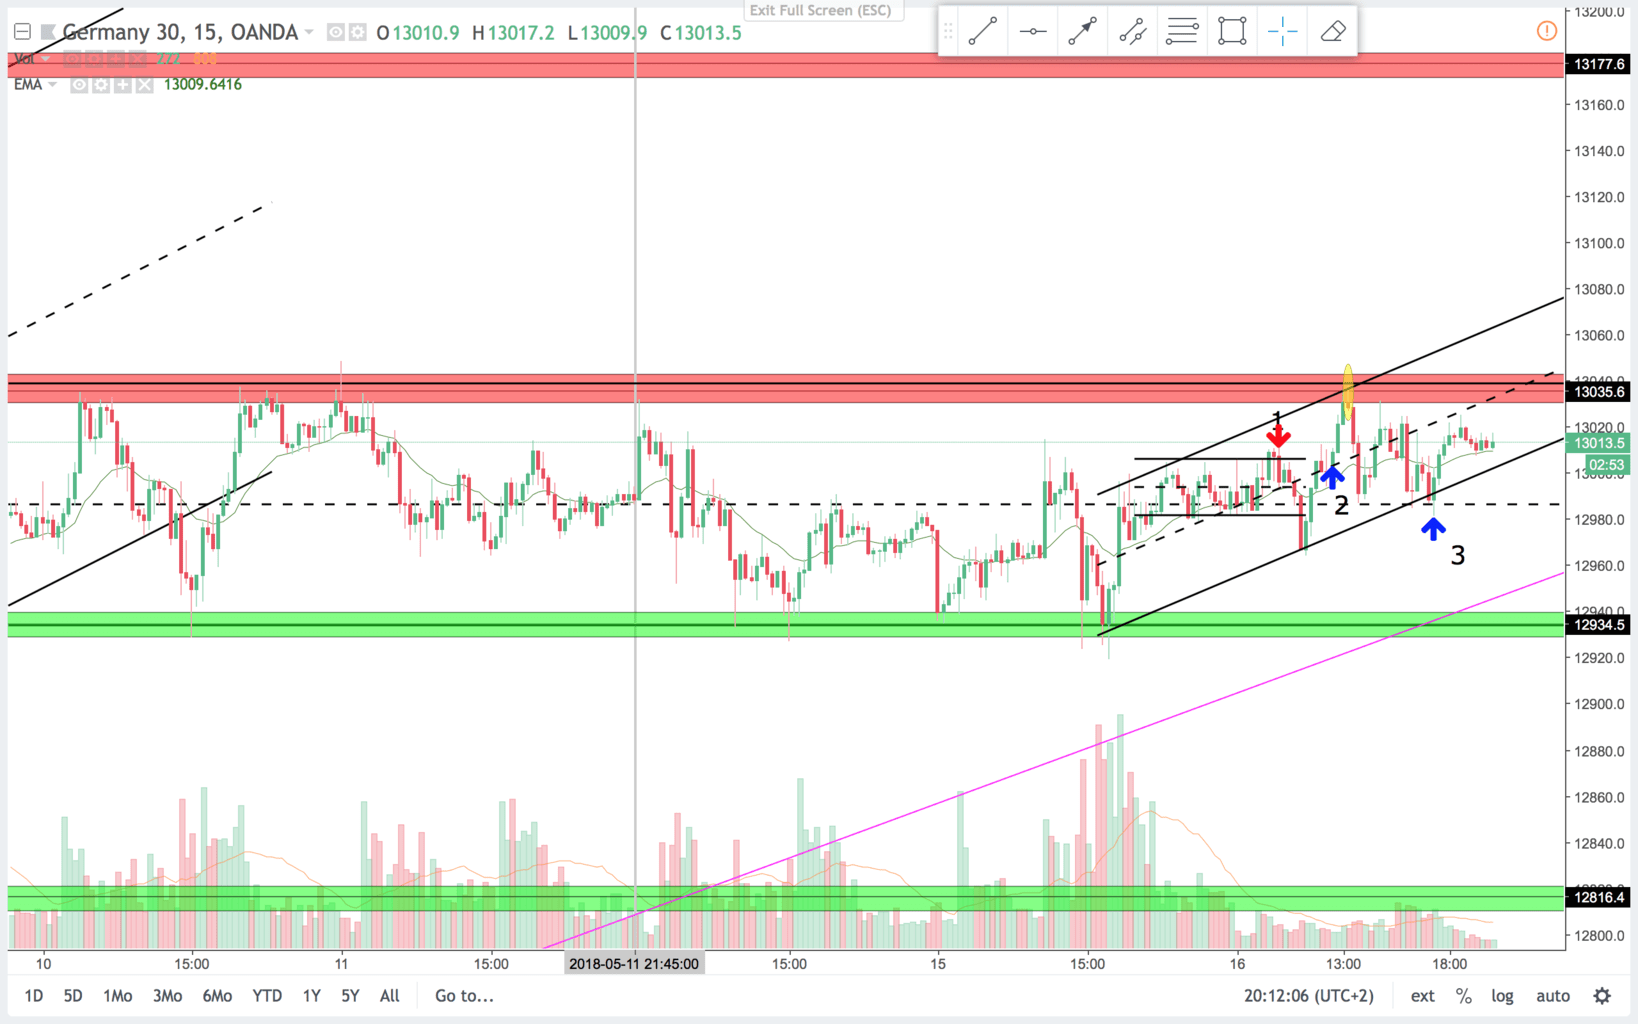
As I mentioned on the monday video, I expected sideways trading. That is what we got. Again no one knows that, the pattern of the spike and channel and the break of the trendline on the bull channel has a high probability of forming a trading range. Often you see trading ranges within larger trading ranges. As was the case on trade 1 and 3. So now price is in a protracted trading range. I expect a breakout of this range within the end of this week. On the daily and 4 hour charts price is always in long, so probability for a breakout to the upside is slightly larger than a breakout to the downside.
Trade 1:
15 min chart:
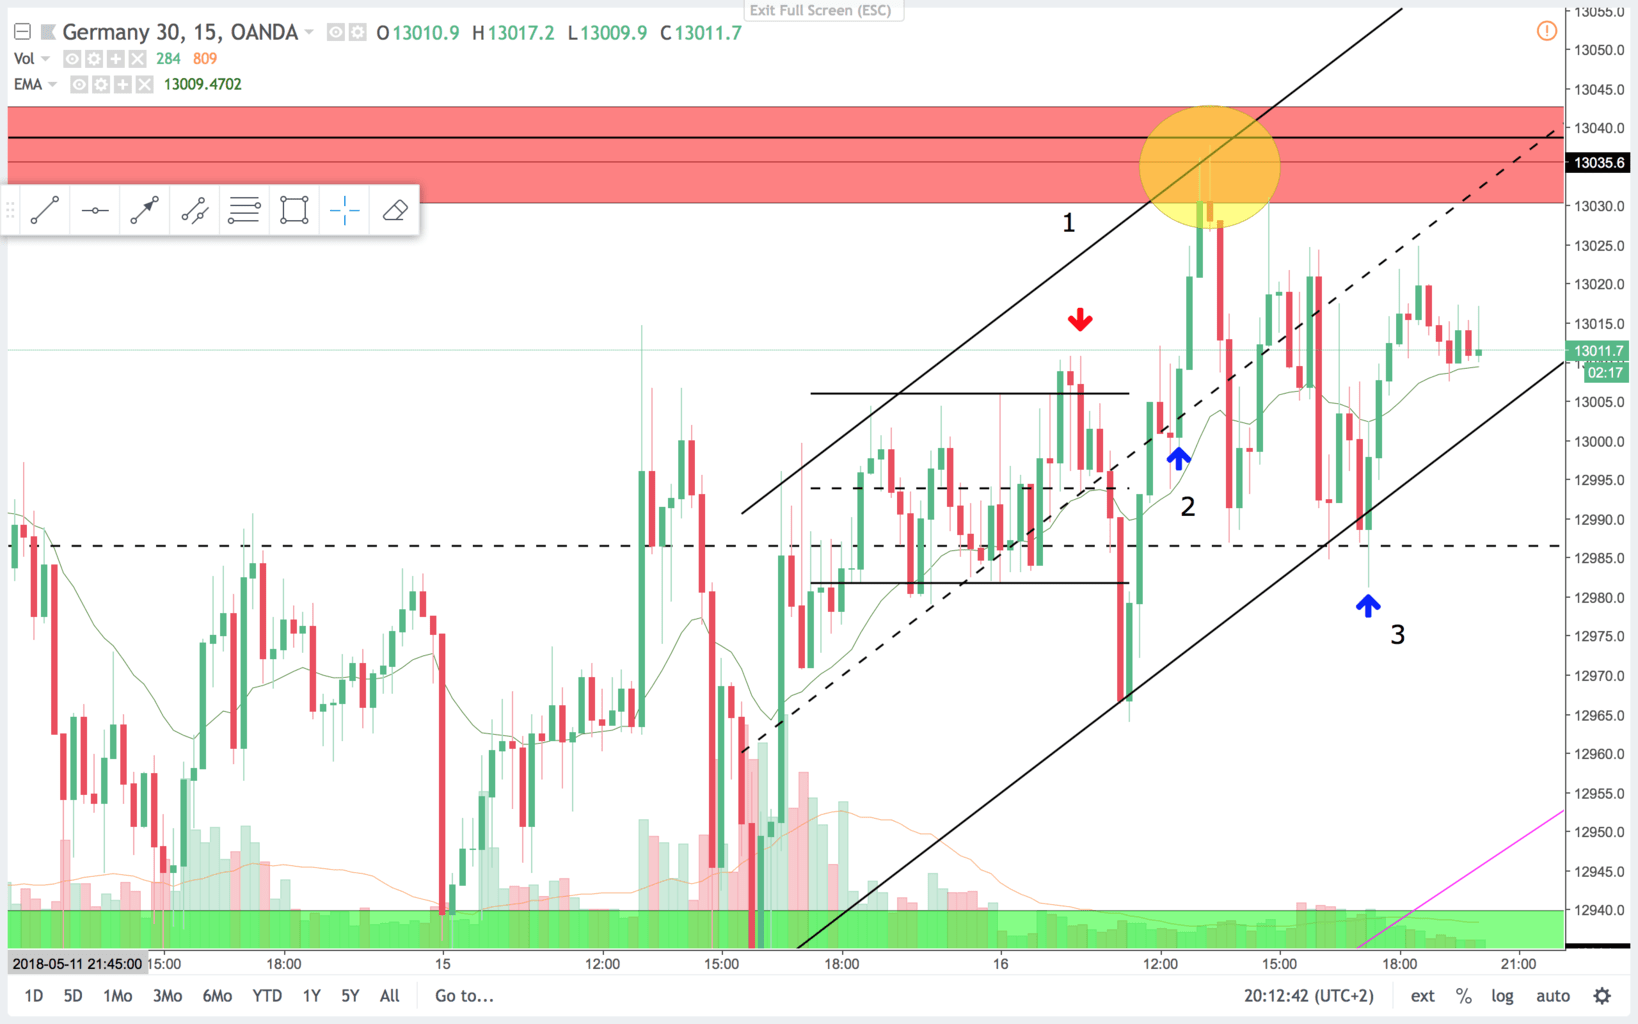
On the 15 min chart this is a clear minor trading range. And a failed breakout to the upside. The entry is near the middle of the range, and that makes this trade risky. Target was the low of the minor range. You end up getting a failed BO below the range and a nice trade.
5 min chart:
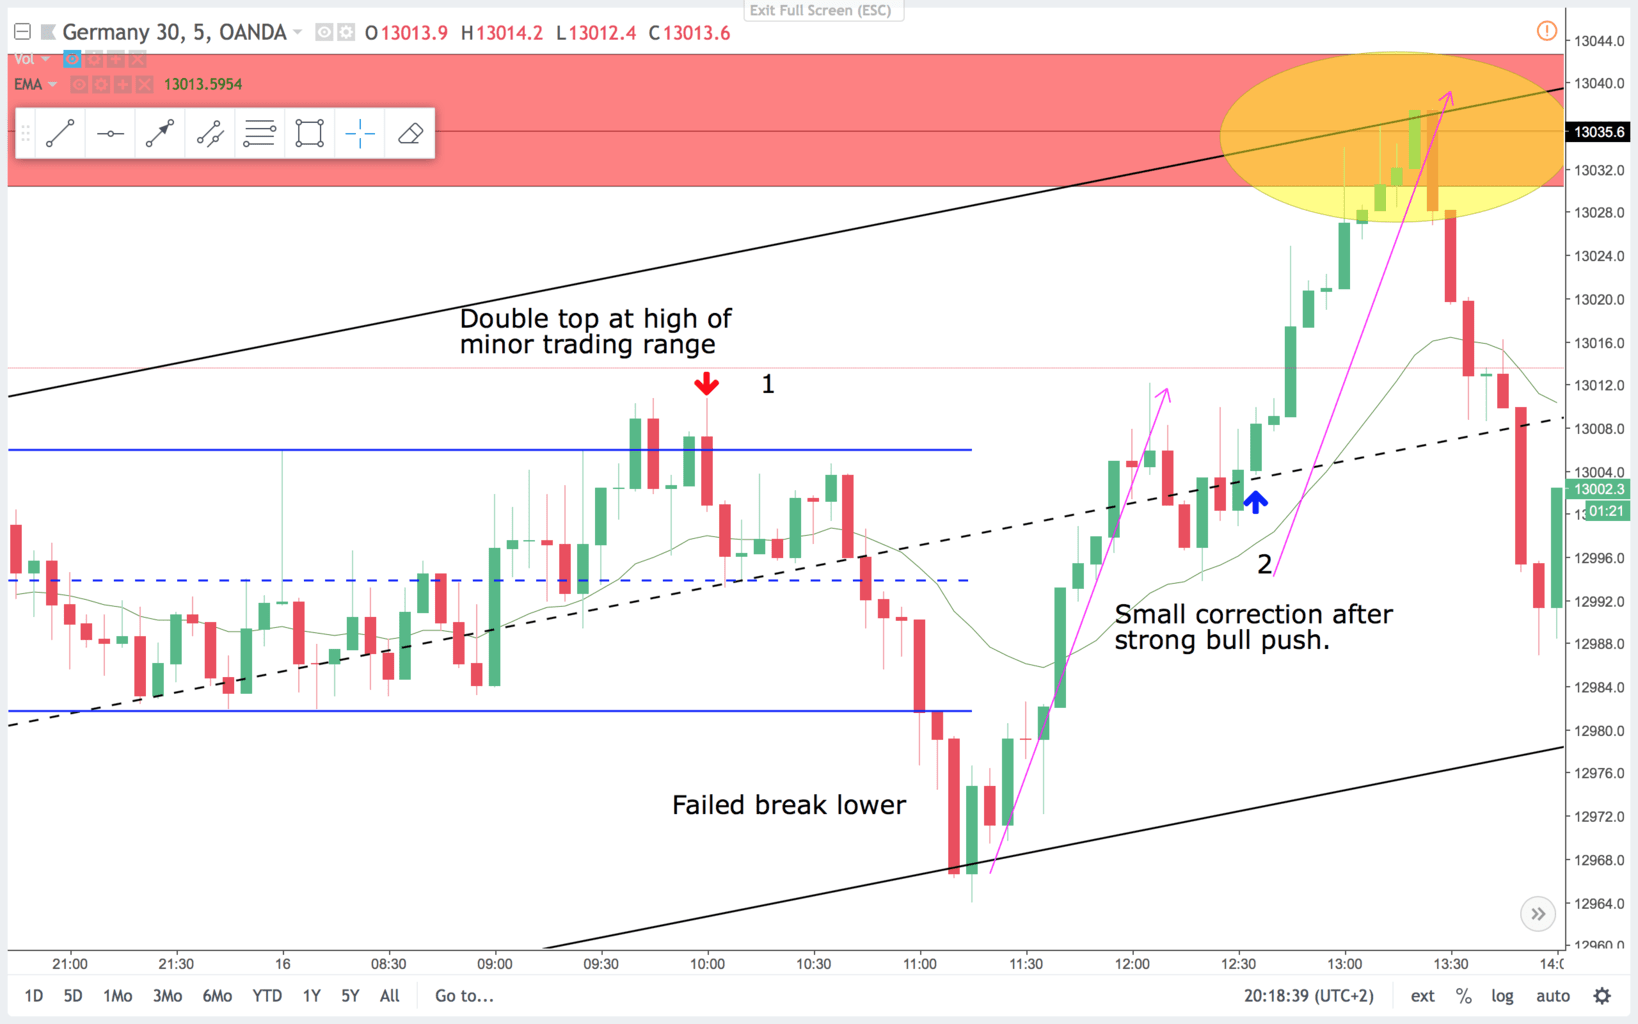
On the 5 min chart the open has been in a context of a trading range, with lots of overlapping bars and poor follow through on the buy side. The double top within the first hours of the DAX trading day is common for a high of the day. Today we traded back above the high though. The setup was a failed break higher and a double top. The blue lines outline the minor trading range. Around 80% of breakouts fail in a trading range. So nice probability on this trade. Signal bar was good with the low close. You could add on on the double top that followed in the next 40 minutes.
Trade 2:
On the 15 min chart this is a first entry and the play is, that the minor trading range had a failed BO below, that often fuels a BO to the upside side. Takes guts to go long into the resistance area.
On the 5 min chart you had a strong bull leg. With a failed break lower and bull strength like this, you are likely to get a second leg up. In this case it is just short of a measured move. It is though into a major resistance area and at a bull channel line(Yellow circle). That is a nice place to manage any longs.
Trade 3:
On the 15 min chart this is a great trade. You have support from the prior double bottom, and then it confirms the bull trendline. Also it is a failed break below the double bottom. Nice big bull bar that closes in the upper third.
5 min chart:
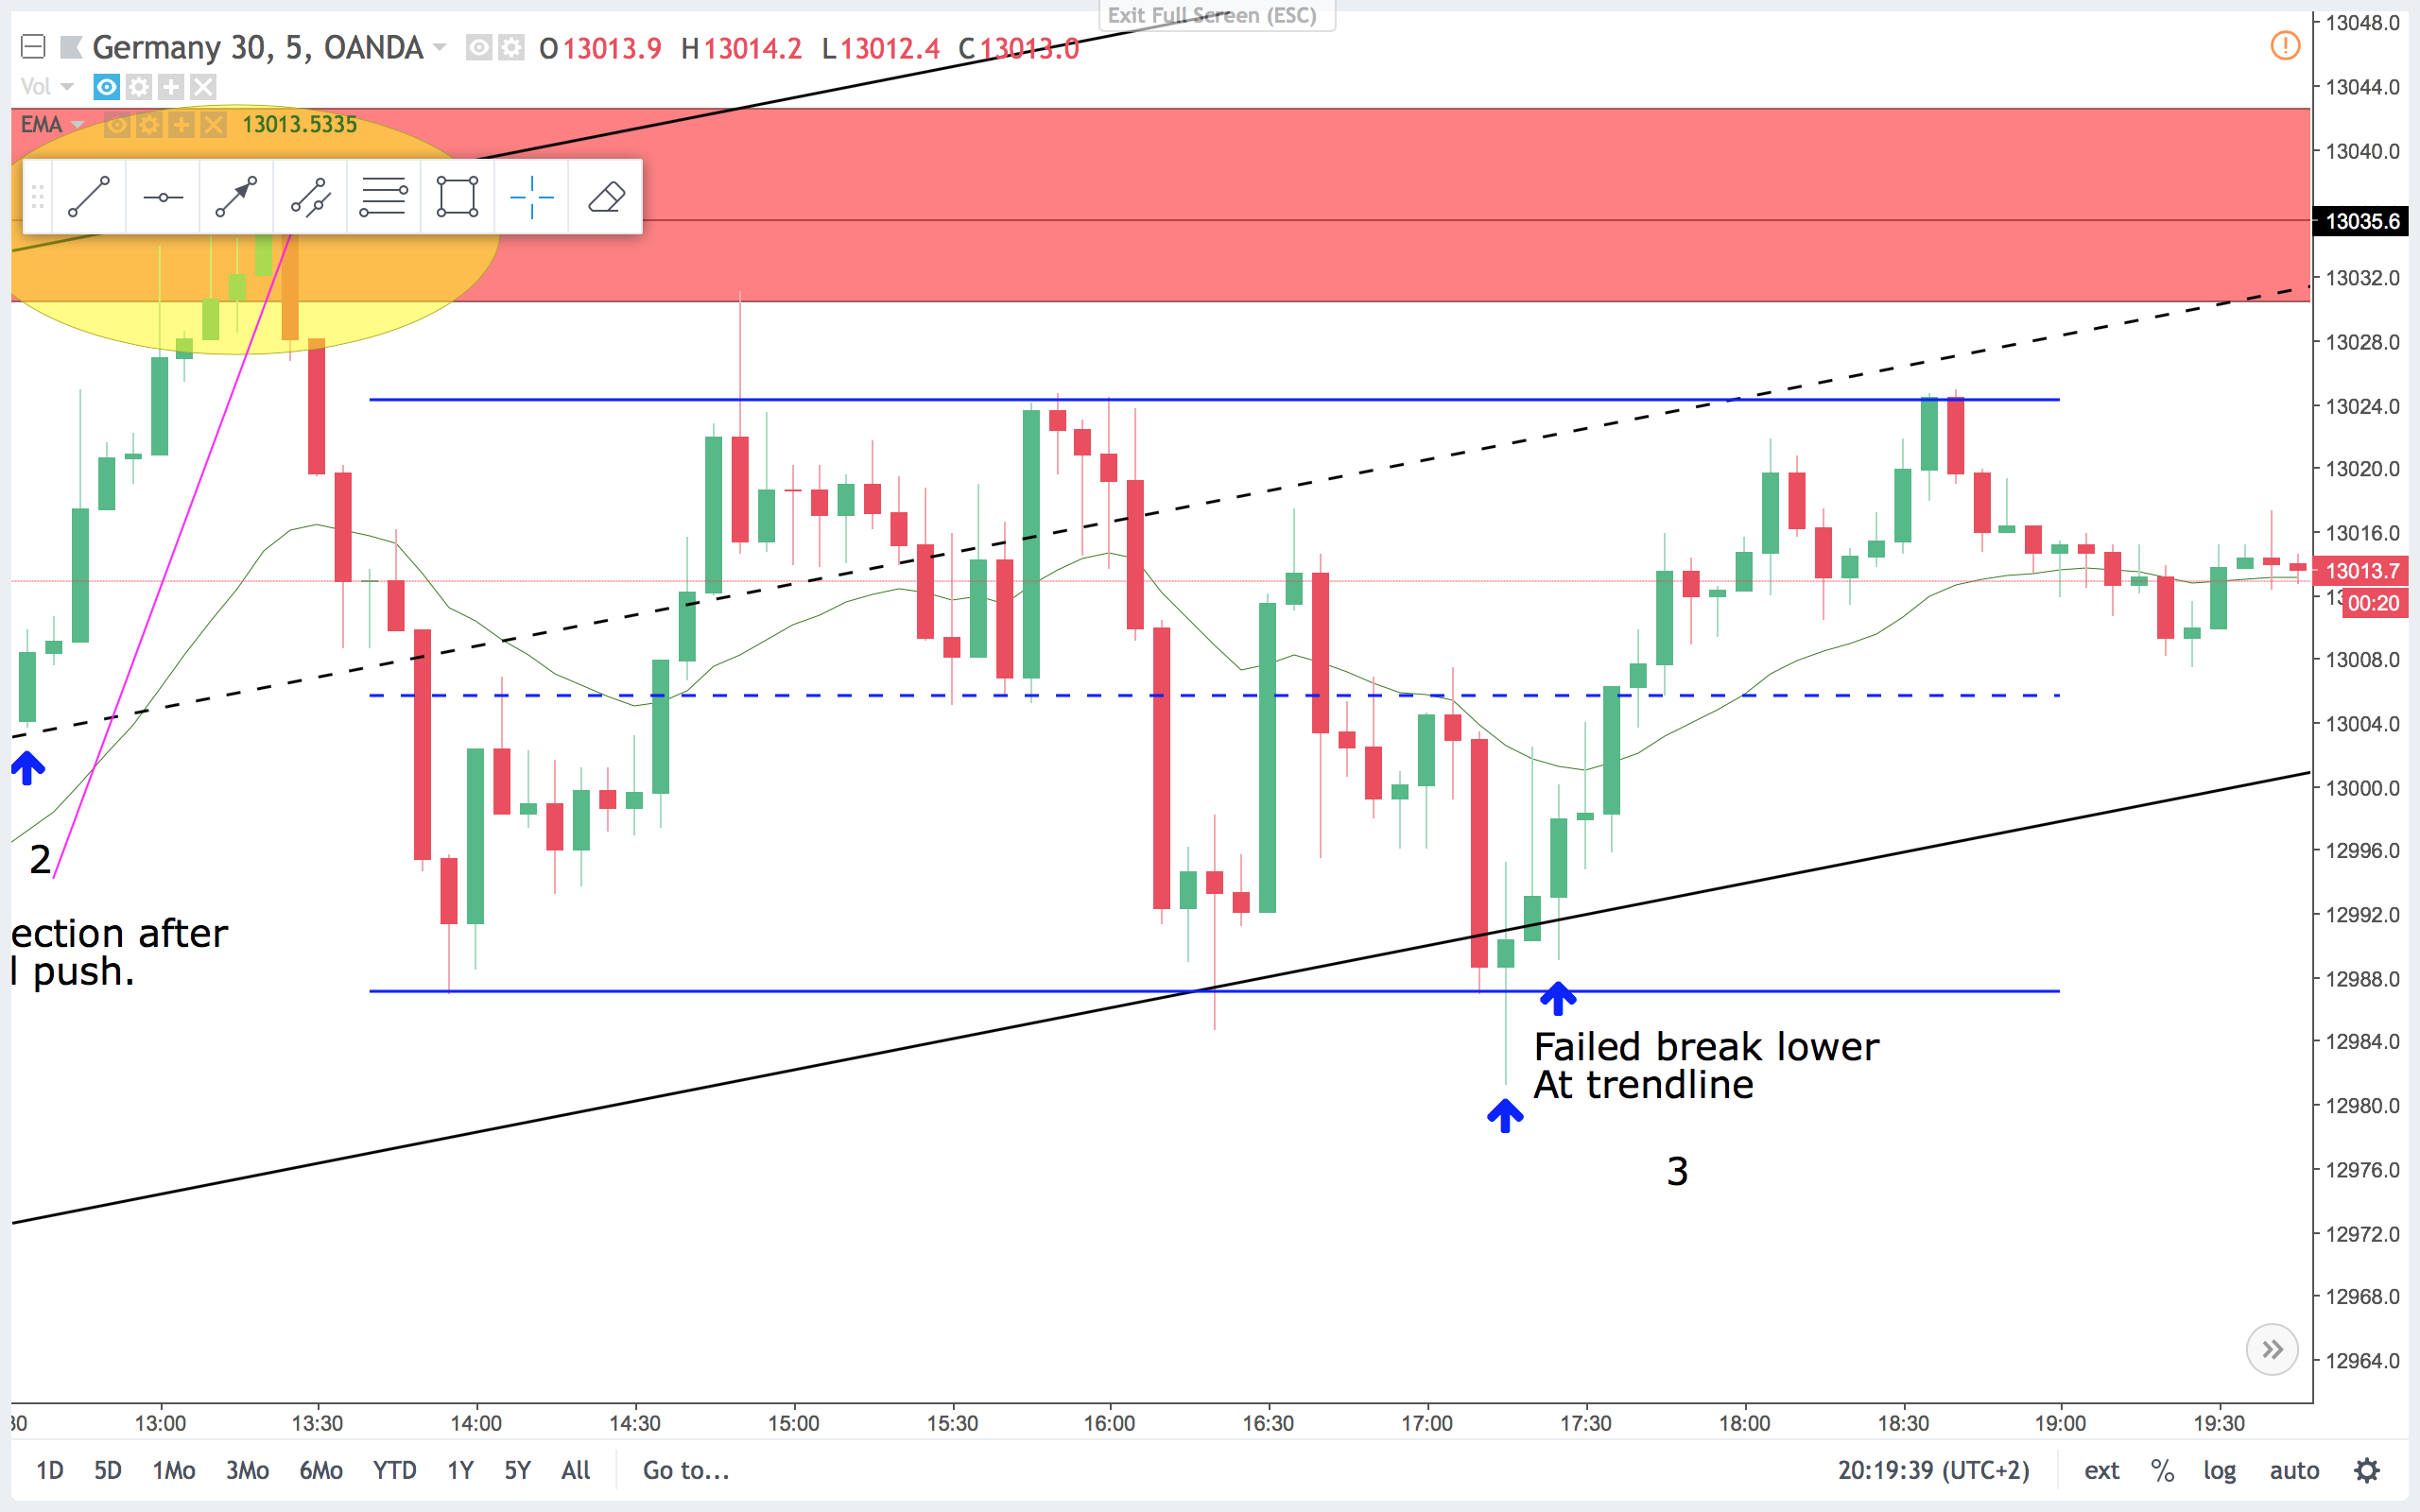
On the 5 min chart I marked two signals. Problem with this trade is, that the signal bar had a large tail above. I do not like signal bars that are more dojis that strong trend bars. The second blue arrow is also a higher low bull signal. I like that better. It is a trade late in the day, but I like to risk it.
On trade 3 you had a better signal bar on the 15 min chart, so use that if you are looking for a signal, and the 5 min bars are not producing them for you.
When the market is in a major trading range, there often is a lot of nice trades in minor trading ranges nested within the larger range. And if you take a look at the larger context you know where to look for swing entries and management points.