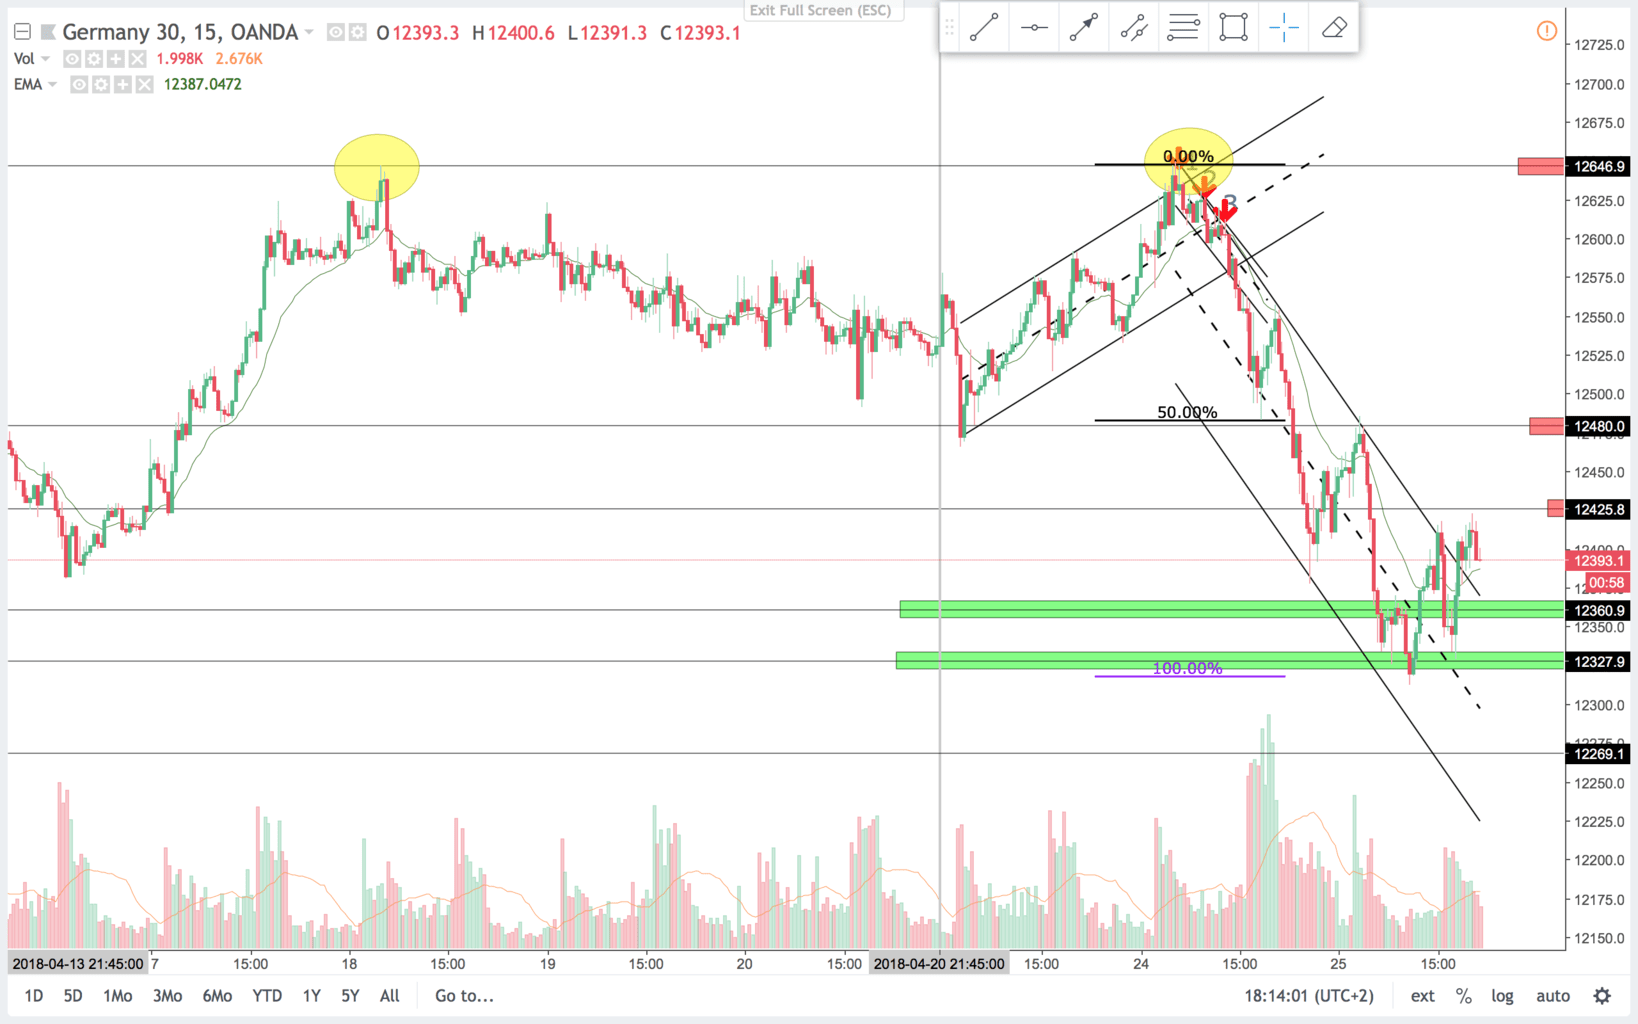
Price is moving down from resistance breaking out of the upper TR(Trading Range). In the end of last week we traded sideways in a bear channel. This week we got a double top, price sold off in a three push pattern. Now price broke out of the trendline and we could see a correction. Still price is always in short, so look to swing shorts and scalp longs. Price also made a 100% expansion of the first bear leg. A typical price movement in a larger leg. There is major support at 12.270 area where I will be looking to manage any short positions.
15 min chart:
Trade 1:
15 min chart:
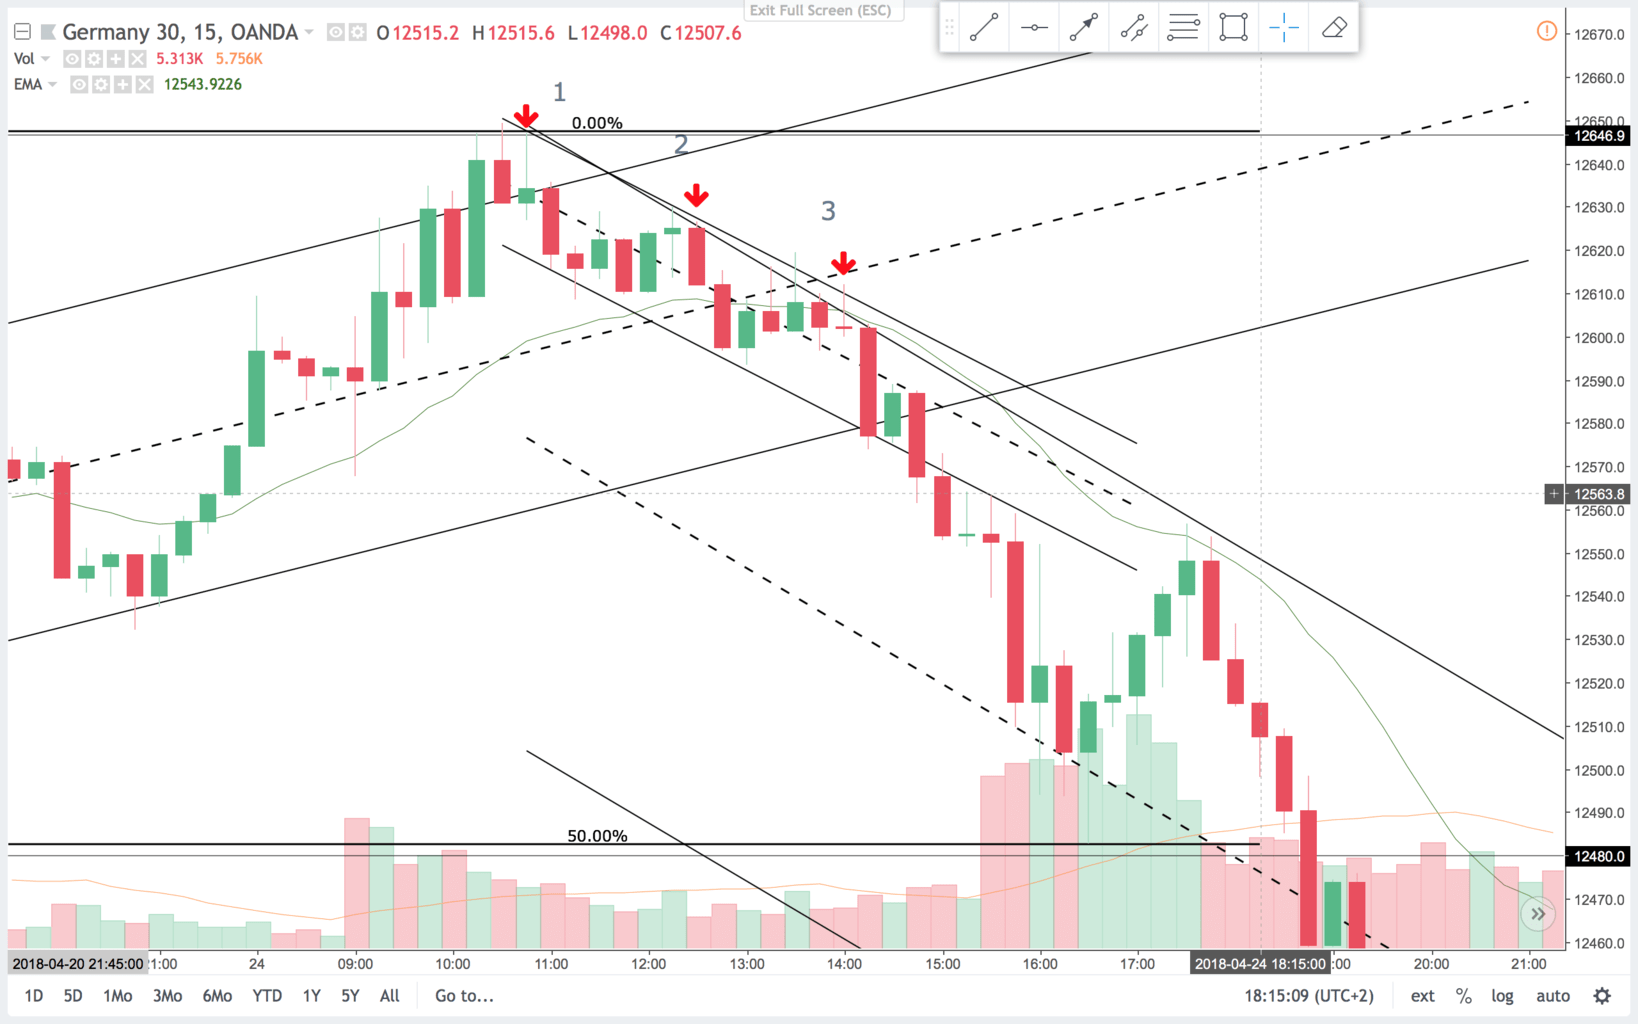
On the 15 min chart you can see the on the final leg up, that there is a bear bar after every bull bar. Still higher highs and lows, but not good of follow through. Also we were nearing the channel line and overshot it a bit into the resistance area. That gave me confidence to manage longs and look for a short scalp. Often after a overshot of the channel line, you get a break on the trendline.
5 min chart:
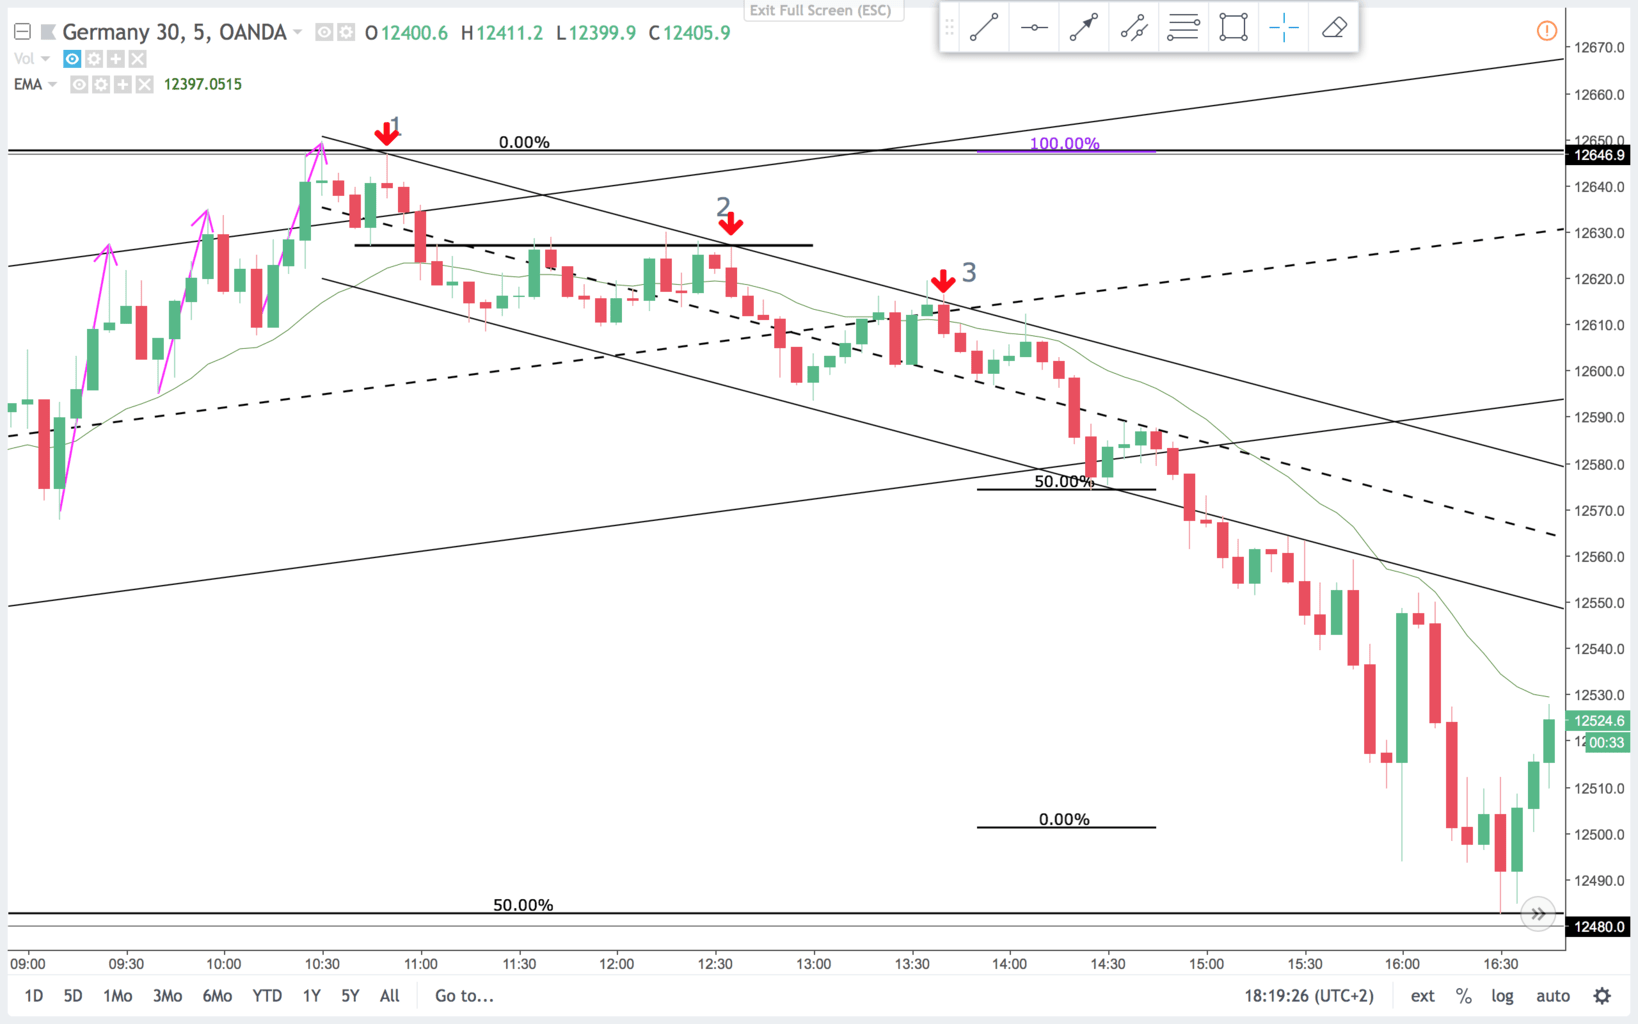
On the 5 min chart this is a hard trade. It is in a bull market. But the double top after the three pushes up often leads to a correction. On the signal bar I closed the last of my longs and went short. Potentially a two leg correction, or a correction to the larger bull trend line below.
Trade 2:
On the 15 min chart this is a failed second entry long bear bar closing on the lows. It is a breakout pullback sell signal for a second leg down.
On the 5 min chart this is the high of a TR. Prior support has become resistance. When the signal bar traded above the bear inside bar and turned down I liked it for a short.(You could wait for the close or sell as it broke below the inside bar). Price made a second leg down. Now you got a potential bear trend channel.
Trade 3:
On the 15 min chart this is a confirmation of the bear trendline. A second entry short. And look at those tails above the bars. Now the market is surely always in short. But even more so after the break of the bull trendline. You could expect a 100% expansion of the open range. But got much more than that. You got a 100 % expansion of the first bear leg. And price is still always in short.
On the 5 min chart this is where the second entry short happened. And that was just at the trendline and the EMA. Price testet the BO(Break Out) area from trade 2. If you got into any of the three trades and kept runners, you did fine yesterday.
Trend and channel lines are a nice tool. Both for profit taking and trade entries. If a channel is broken but the BO fails, like at trade 1, then expect a break of the trendline. If a BO of the channelline has follow through like on the bear trend channel. Then it is a BO on a higher timeframe, and you are looking to get in for any reason.
Have a nice trading week.