So this week was very hard to trade in my opinion. There was a lot of reversals and up down trading. Reversal that set up without good signal bars. If markets are like this, then go to the 5 min and trade for scalps, or wait, wait, wait. Today price made a nice spike up in the premarket. But as we opened price was into resistance, so going for much more than a scalp is hard to do. Then you could look for sell signals at resistance. But the bull leg was strong enough to make the market always in long, so I would not look for shorts before a top pattern has formed.
15 min chart:
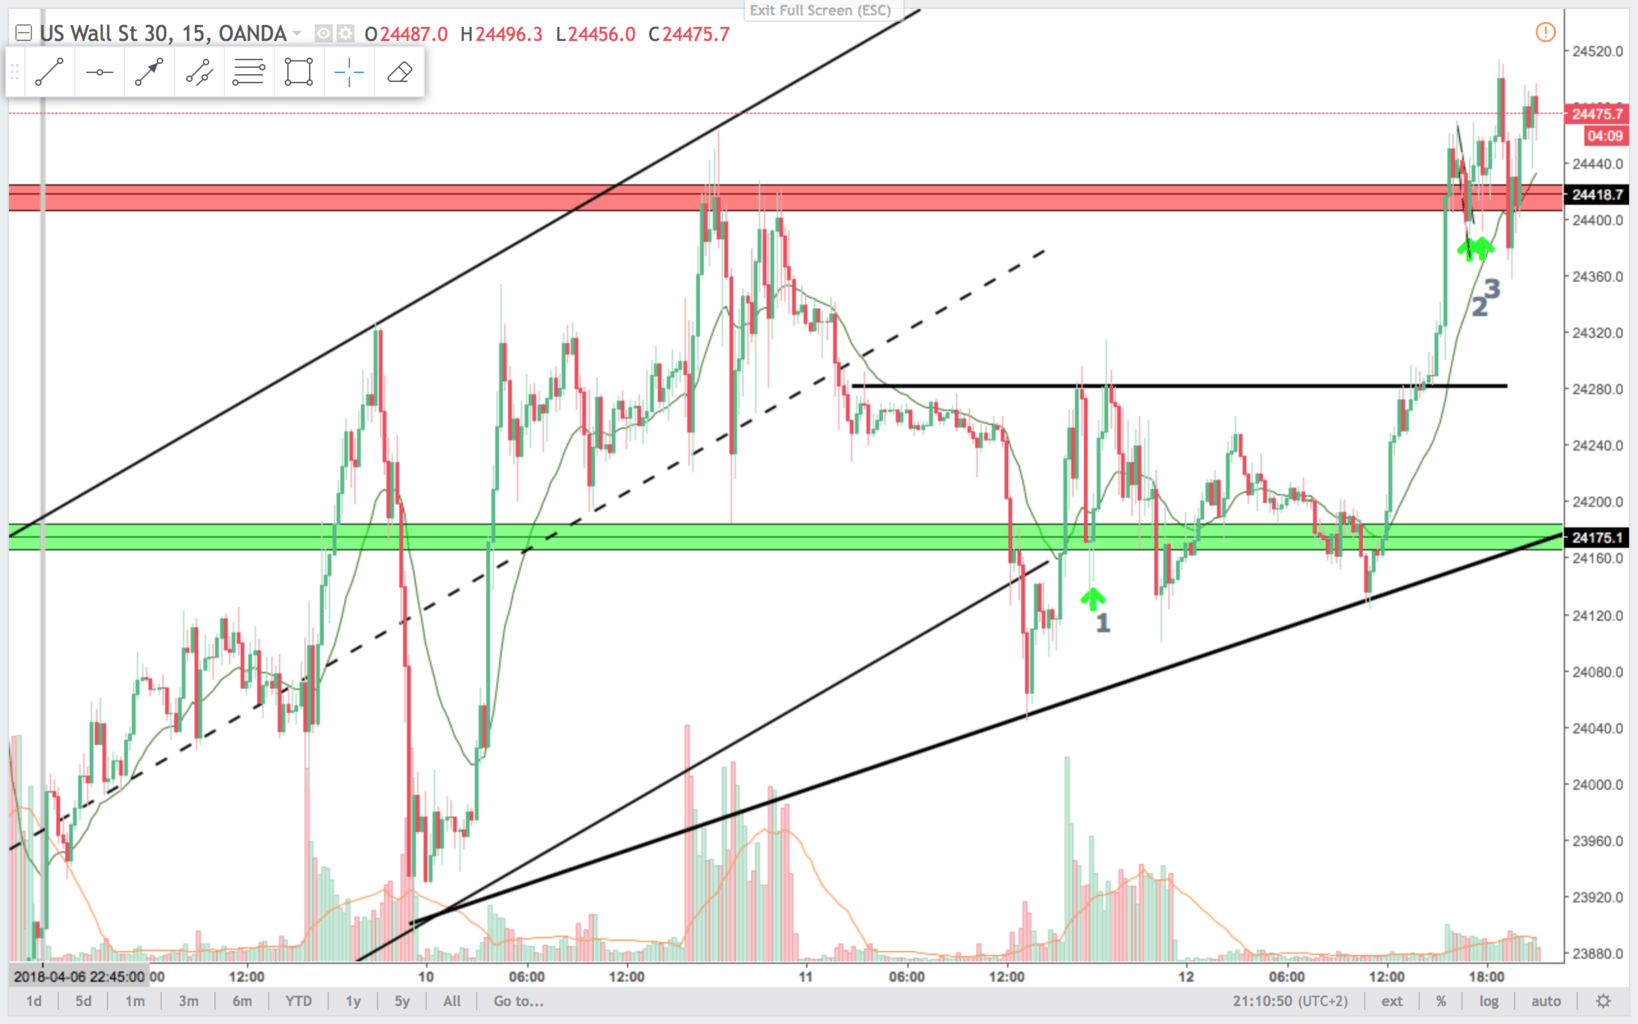
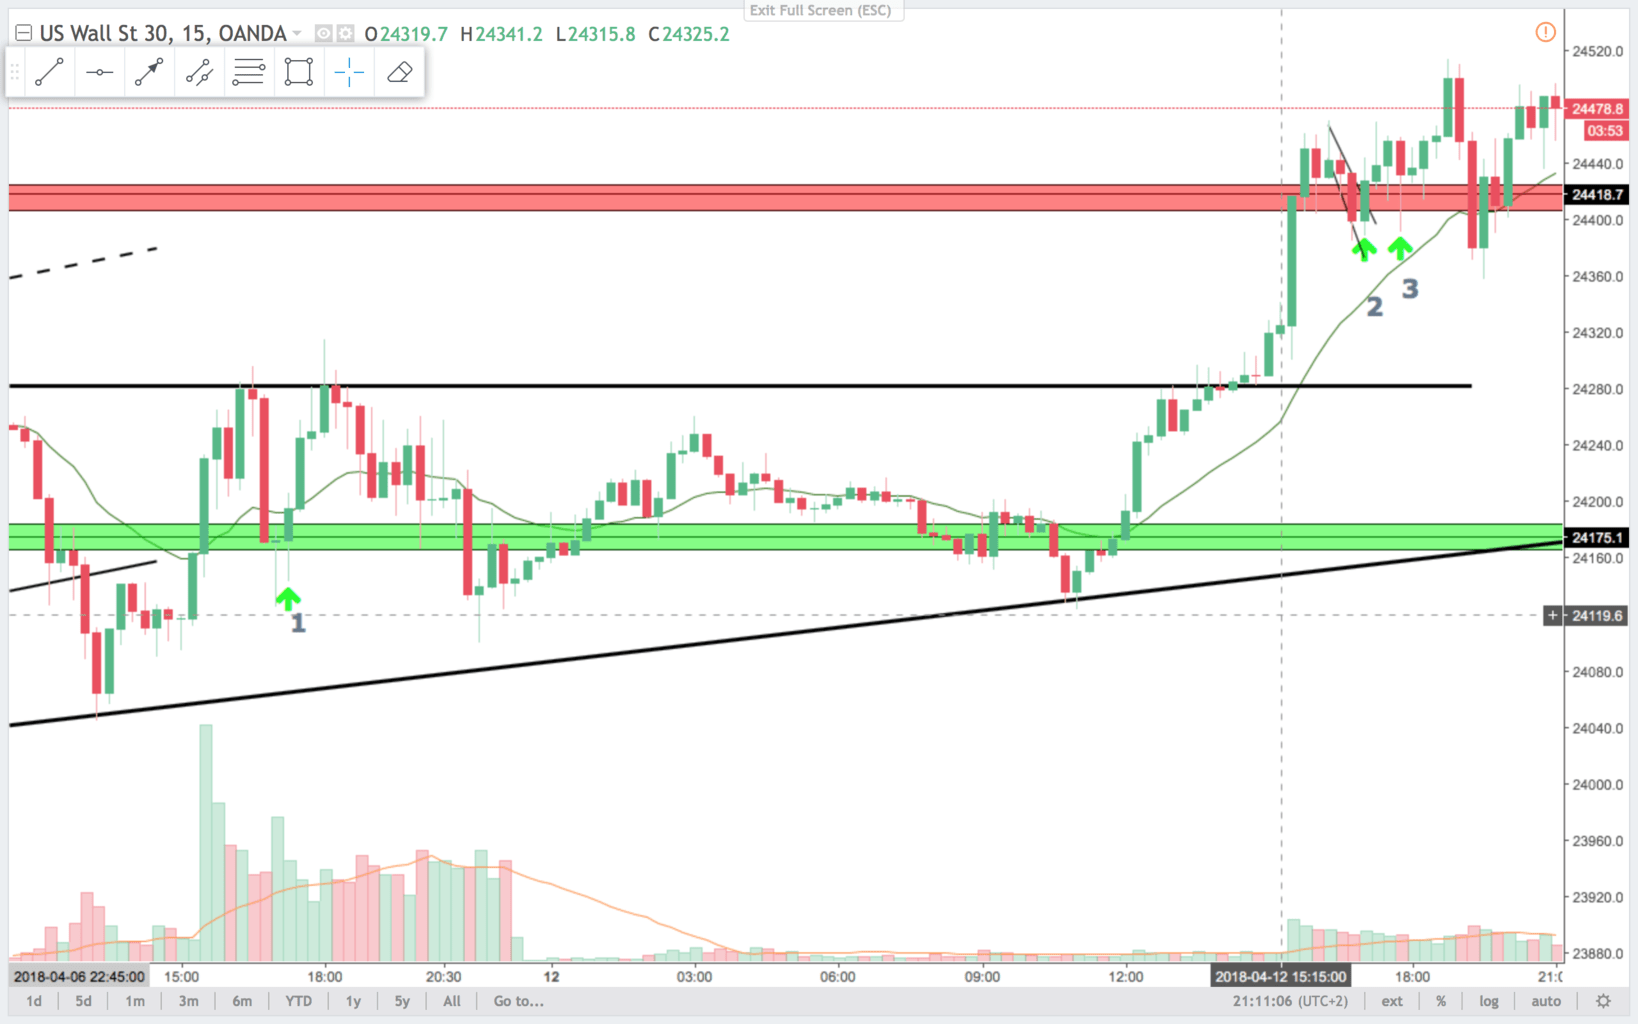
Trade 1:
On the 15 min chart this is a bull bar micro double bottom. It is a first entry, but also a breakout pullback long signal. Problem is, that it is only a first entry and the large bear bar from the high. You think that the high will get tested again. And that is what happend.
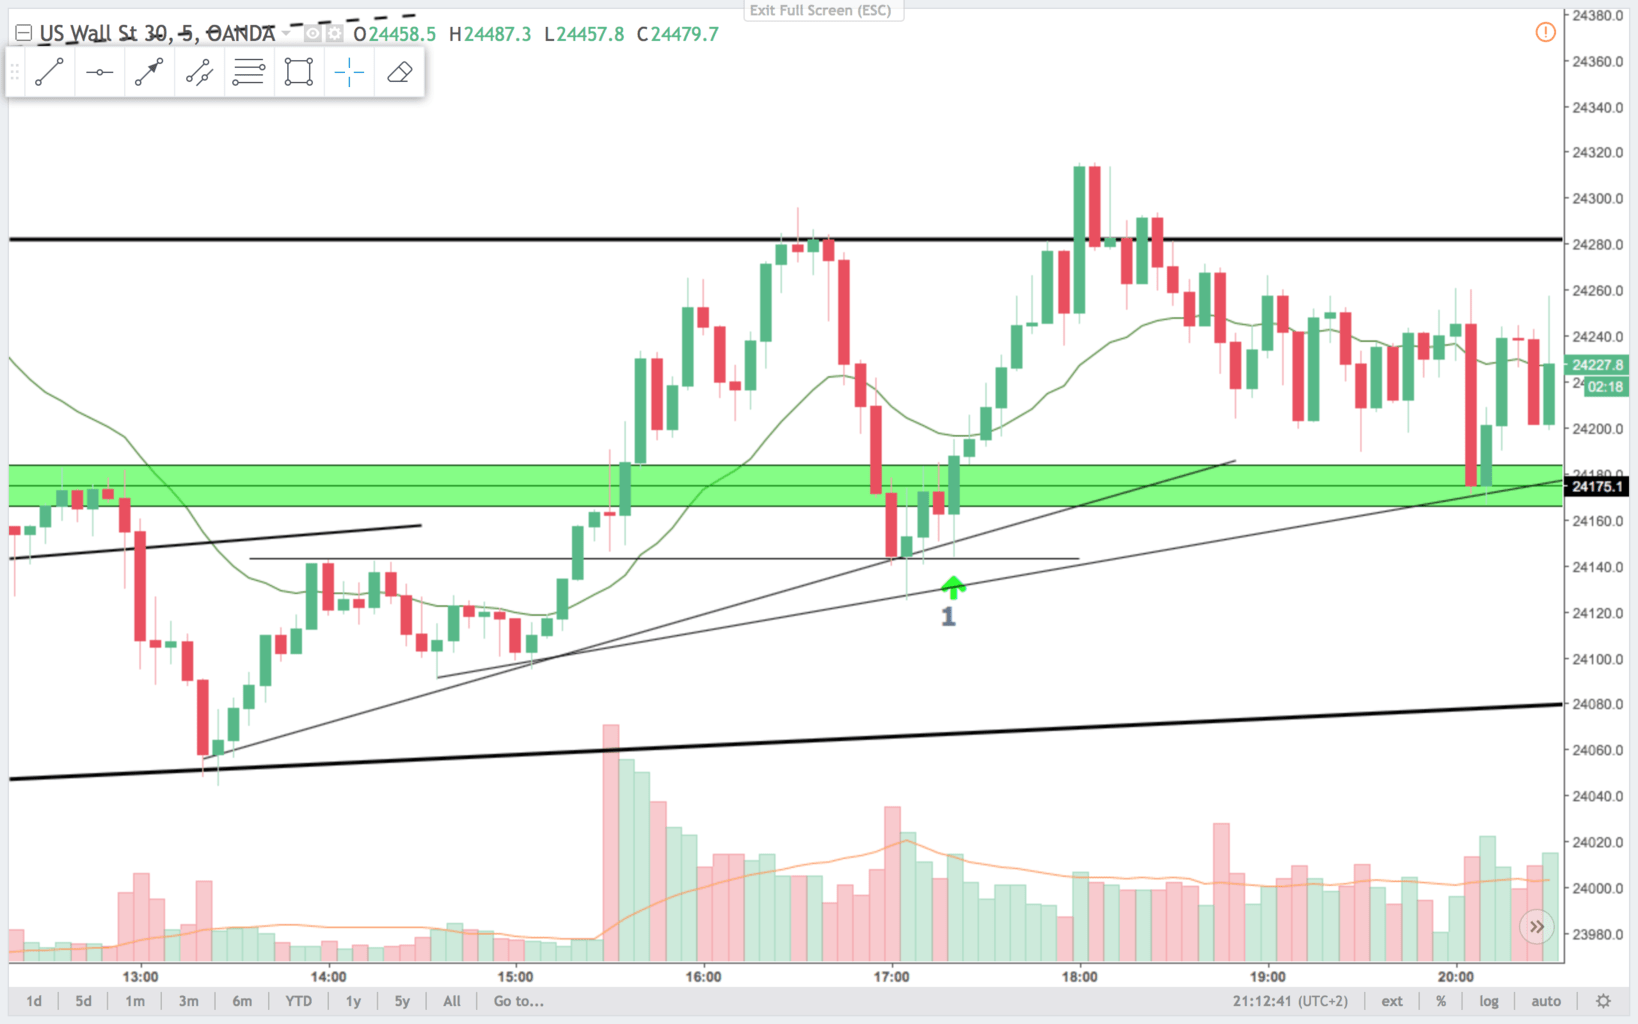
On the 5 min chart you get three lines that is support in this area. First is the highs to the left that also is a support for the BOPBL (Break Out Pull Back Long). Second is a trendline from the two lows at the prior lows, and finally a bull trend line from the low 13:15. You get the higher low and a bull bar that closed on the highs after testing below the prior bar. That makes it a outside up bar. I will risk that for a long.
15 min chart:
5 min chart:
Trade 2:
On the 15 min chart pris is always in long. A strong bull break out. Look for longs. Problem is, that it is intro resistance. But a retest of the high is likely. Liked this and trade 3 better on the 5 min chart.
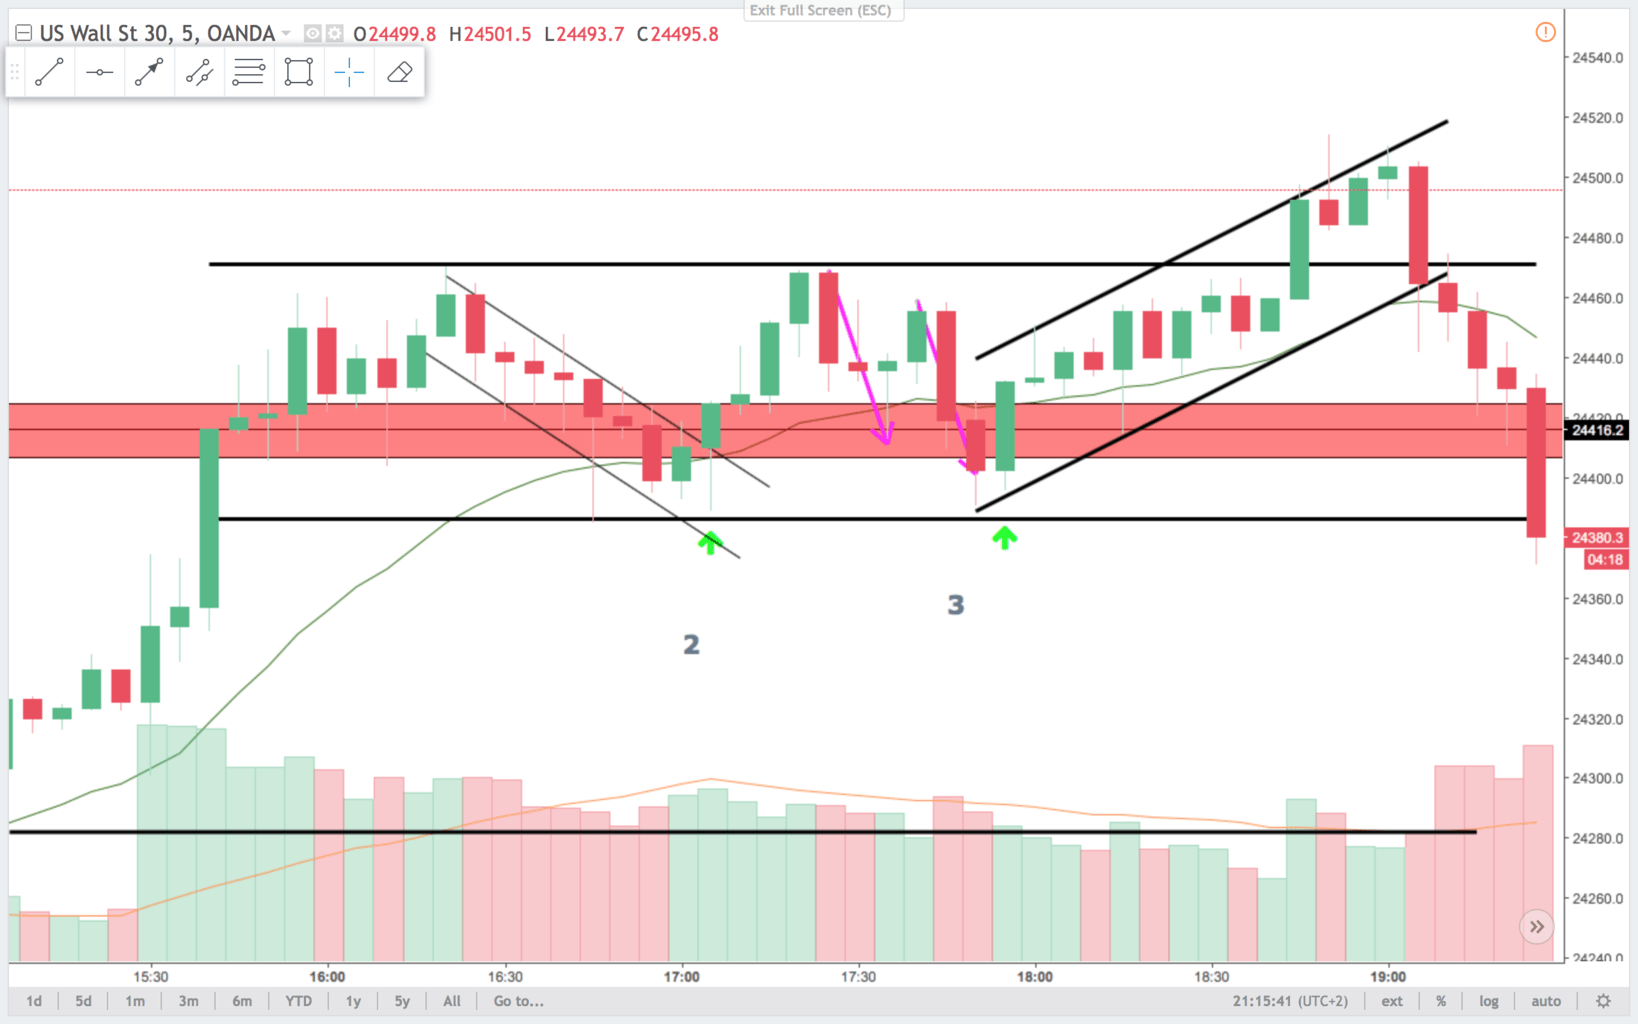
On the 5 min chart this is a double bottom outside up bull bar. I like that for a retest of the highs. Also it is a second entry long after a weak bear leg. Notice how price bounced on the first test of the support line.
5 min chart:
Trade 3:
On the 15 min chart this is not a setup. You could buy at the low at trade 2 betting that the bull trend will continue higher.
On the 5 min chart this is also a second entry long. The major trend is still always in long. Price has been trading sideway now for so many bars, that the probability of a BO in either direction is close to 50:50. Still a small favor for the bulls. I like to risk this signal for a long.
When price is trending, you can’t expect it to make significant bounces at support and resistance lines. The trend has precedence in this case. If a proper top or bottom pattern forms, then the math changes and probability of a bounce at resistance or support is better.
Have a nice trading week.
Claus Andersen