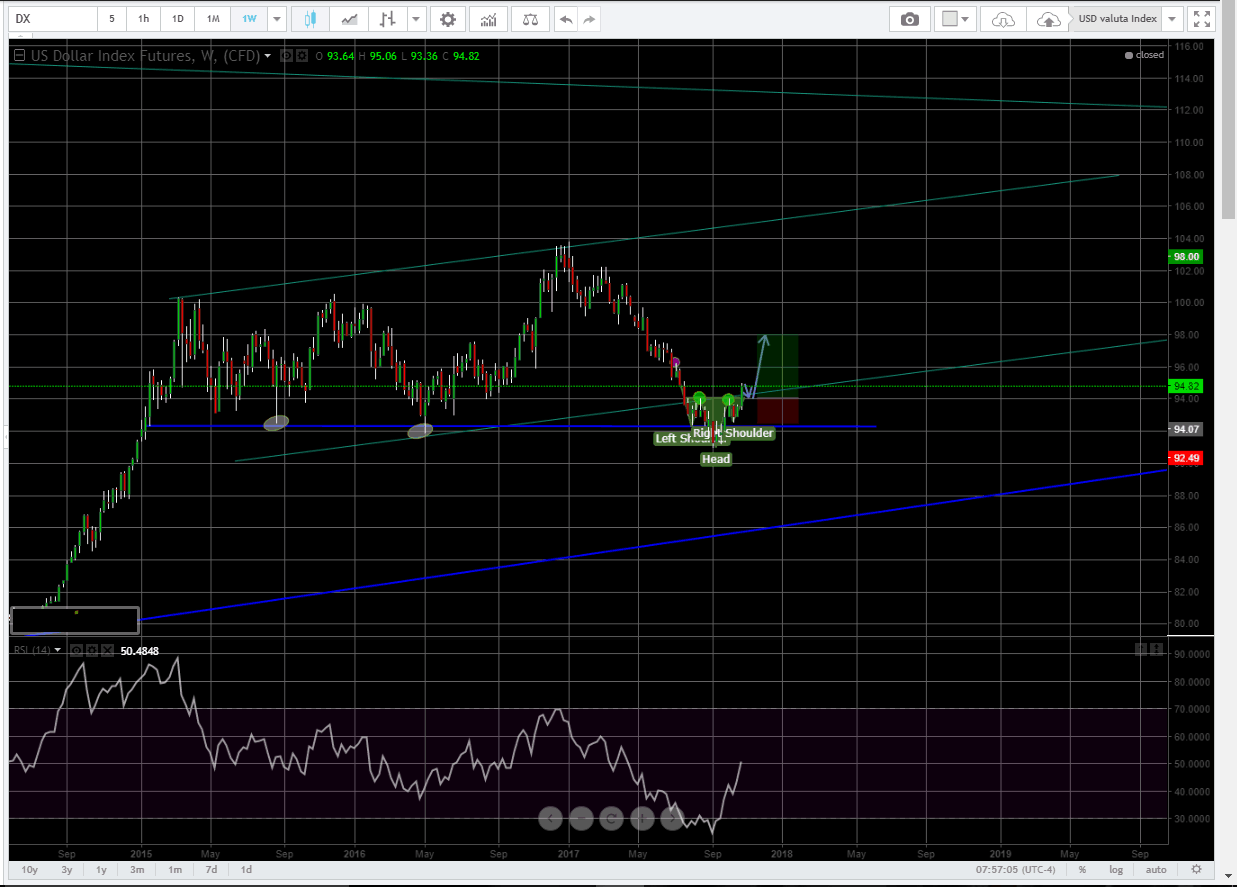
When I look at the dollar index isolated I see a clear strength with plenty of room to the next resistance level.
When the USD back in march/april was on its way down I noticed the two bars at 92 and 92,5 (marked in gray). Here I see an indication of earlier buyers.
The price has been well below but has now returned with great force and is now above the support (marked with the blue line). Here we could see some trapped sellers that now need to close their positions. This usually gives a strong rally in the opposite direction.
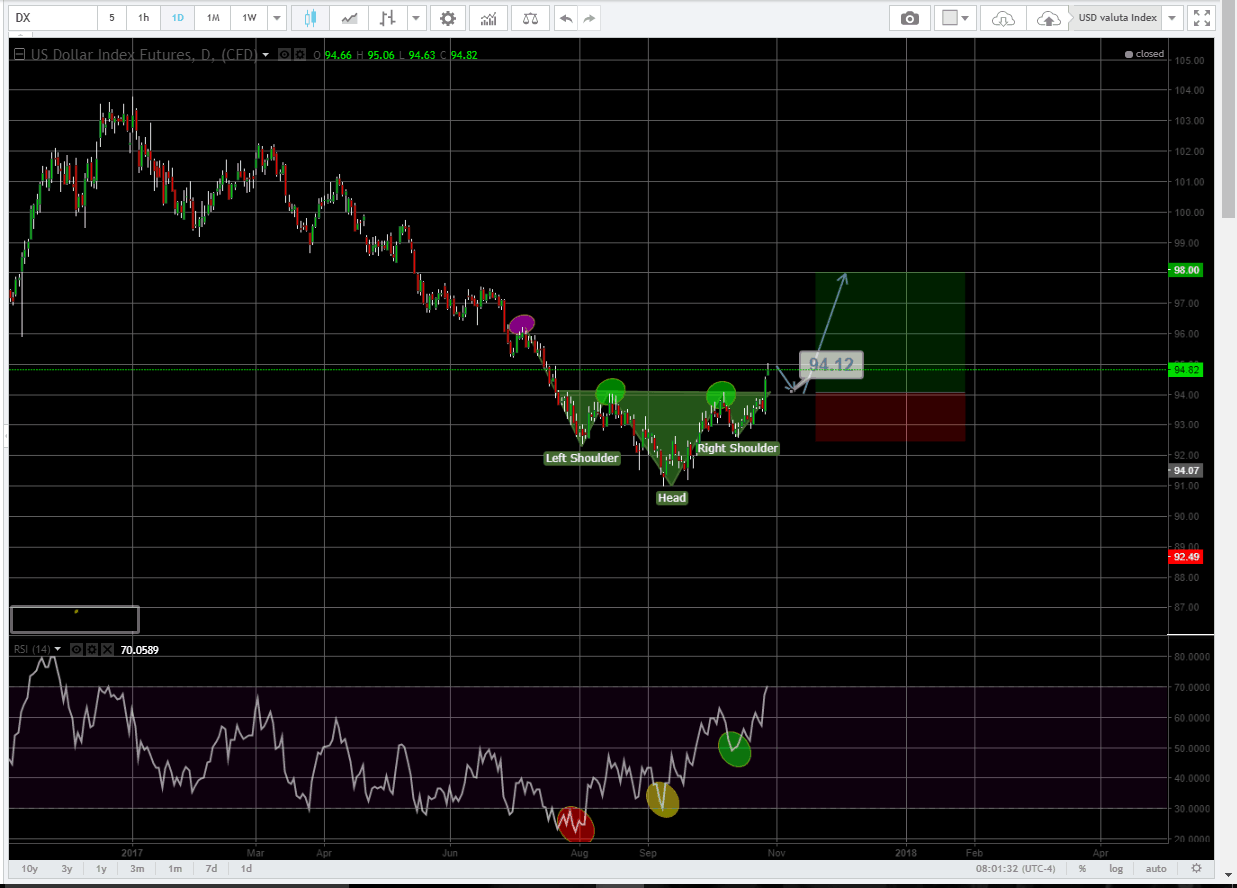
When I zoom in on the daily chart I get confirmation that there is a good chance that the USD will remain strong since I see an inverted Shoulder-Head-Shoulder formation (inv. SHS). There are many opinions on when you can call it an S-H-S formation but for me it’s important that I see clear signals on my momentum tools/indicators in combination with strong price action. In this chart I use RSI.
In this case the left shoulder corresponds with the lowest RSI level. The head in the formation has a rising RSI level but with the lowest price in the chart. So what we see here is an example of a classic divergense which often shows in the S-H-S formation.
Entry
Tomorrow I’ll put in my order at 94$ and then we must see how the market opens.
Stop/Target
I’m putting my stop in right under the last shoulder. If this level breaks the argument for the trade is gone. My target is around 98$. How ever I’m looking out for the 96-level (market with purple). Should the price start turning after this level I’ll take some profit off.
Disclaimer
Daytraderland and the author here can not be held responsible for others trading decisions. You should always use your own methods and strategies to determine your trades, entries, exits etc. This is only meant as inspiration.