
An important factor – not to be ignored in Trading – is volume.
Volume is another word for the total amount of trades, and here we are talking about the number of shares traded, contracts, etc. in a market. If the volume is high, there has been very high activity, and vice versa at low volume.
This may tell us something about how seriously we should take the signals that we notice in our graphs.
If we look at a graph of the German DAX index here, we can see the volume on the graph:
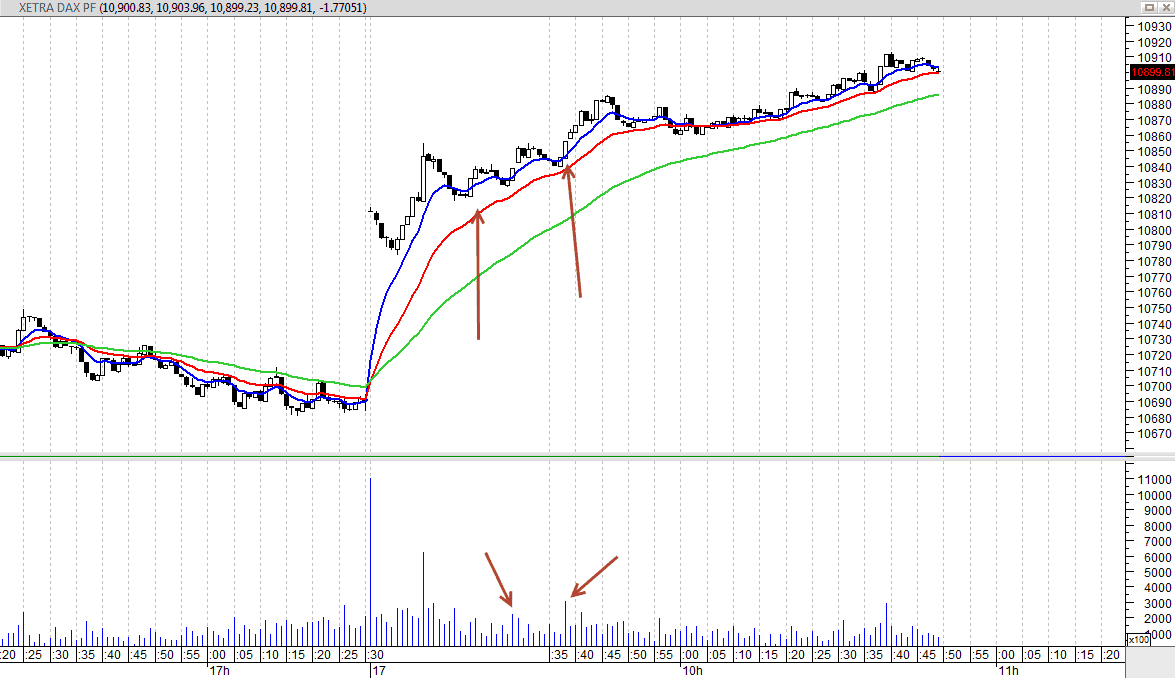
What can we read from the chart?
Here we see DAX revert back to its moving averages, and then get rejected at high volume.
Generally, one can say that a clear move either up or down supported by higher volume than the previous bars, shows that this movement continues with a high probability.
If we see a trend that begins to lose momentum, and this also happens during high volume, then it is usually a strong resistance area, where there are traded many contracts/shares, but where it can not really move the price.
On the chart of DAX above we see a higher volume of two laps when the price shoots up, indicating that this can only be good areas to consider a long position.
Daytrading with volume as an indicator
One does not always have to just look at the raw volume data. It is also possible to do some calculations based on these numbers, so we get a little bit clearer indicator of it.
One of the indicators that I sometimes have on my daytrading chart is the indicator Money Flow Index, which is usually abbreviated MFI.
Money Flow Index
The calculation of the MFI is a bit complicated and I have inserted the calculation at the bottom of the article. But the most important thing to know is that it takes the recent price developments and multiply them with volume. This actually corresponds to if one takes the indicator called RSI and multiplies it with volume. It tells us about the movement we see in the market and if the movement is under high or low volume, and thus how seriously we should take them.
And we also have the ability to spot overbought and oversold areas where we can assume a reversal.
Here we see a chart with MFI inserted:
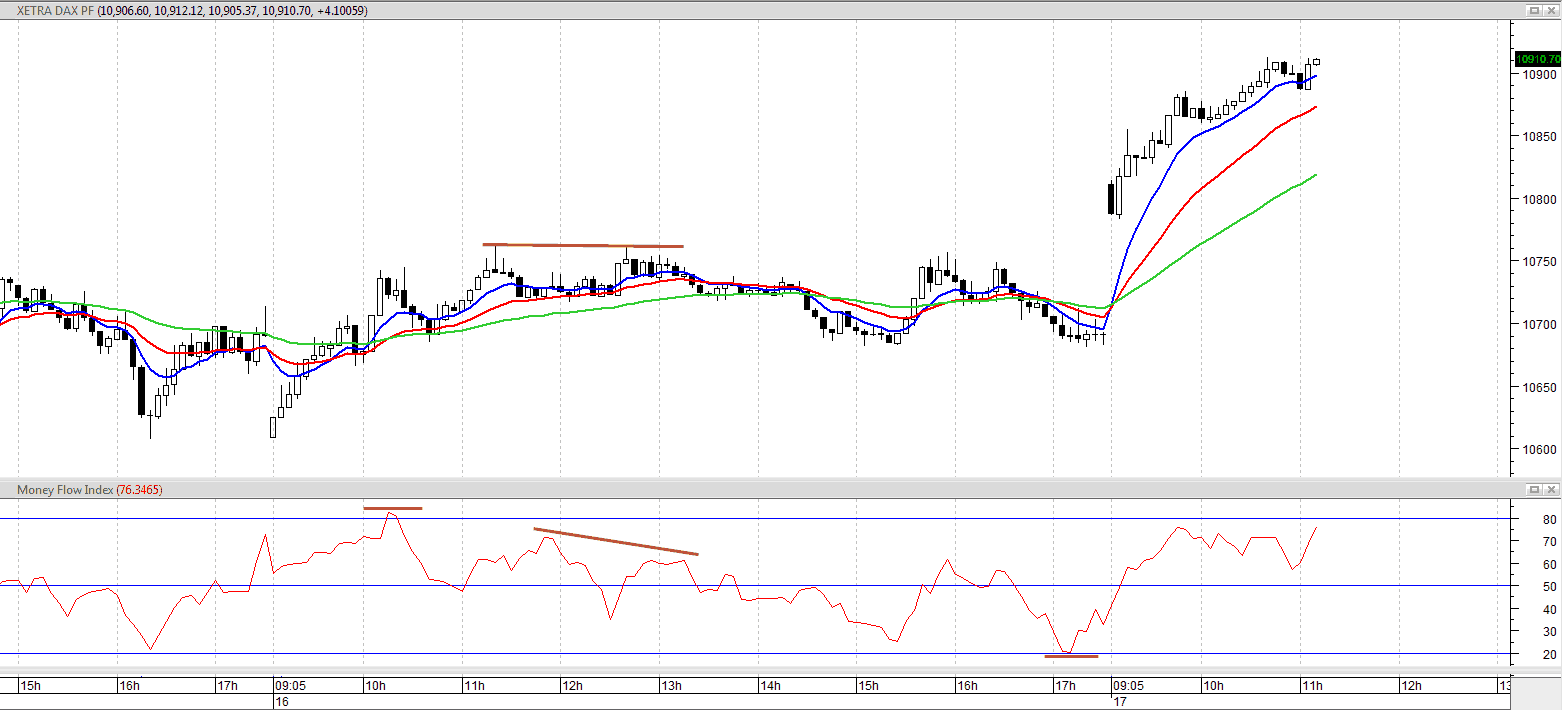
Here you see DAX on a 5-minute chart.
I have inserted MFI below and you can here get a feeling that there are some levels indicating oversold and overbought. Here, the MFI is often really good at spotting potential reversals in the market since it does not only look at price but also volume.
I also drew a trendline showing lower peaks in the MFI, while there are peaks in the price chart. Such a scenario is called divergence. The two movements happen opposite to each other. Here it is always a good idea to keep an eye on volume. When there is suddenly an opposite movement in volume, it is often called a leading indicator i.e. a leading indicator that is indicating future price movement.
To learn more about volume and volume indicators, you can see a video on the topic here: