A lot of daytraders experience that it is not too hard to make money in a trending market that moves in one direction (either up or down), and if you learn to use the ADX indicator, then you can make money both in uptrends and downtrends.
What really gives us daytraders trouble is when the market is in a so-called trading range, where price is moving up and down in a narrow spectrum.
Here is an example of how the market quickly changes character:
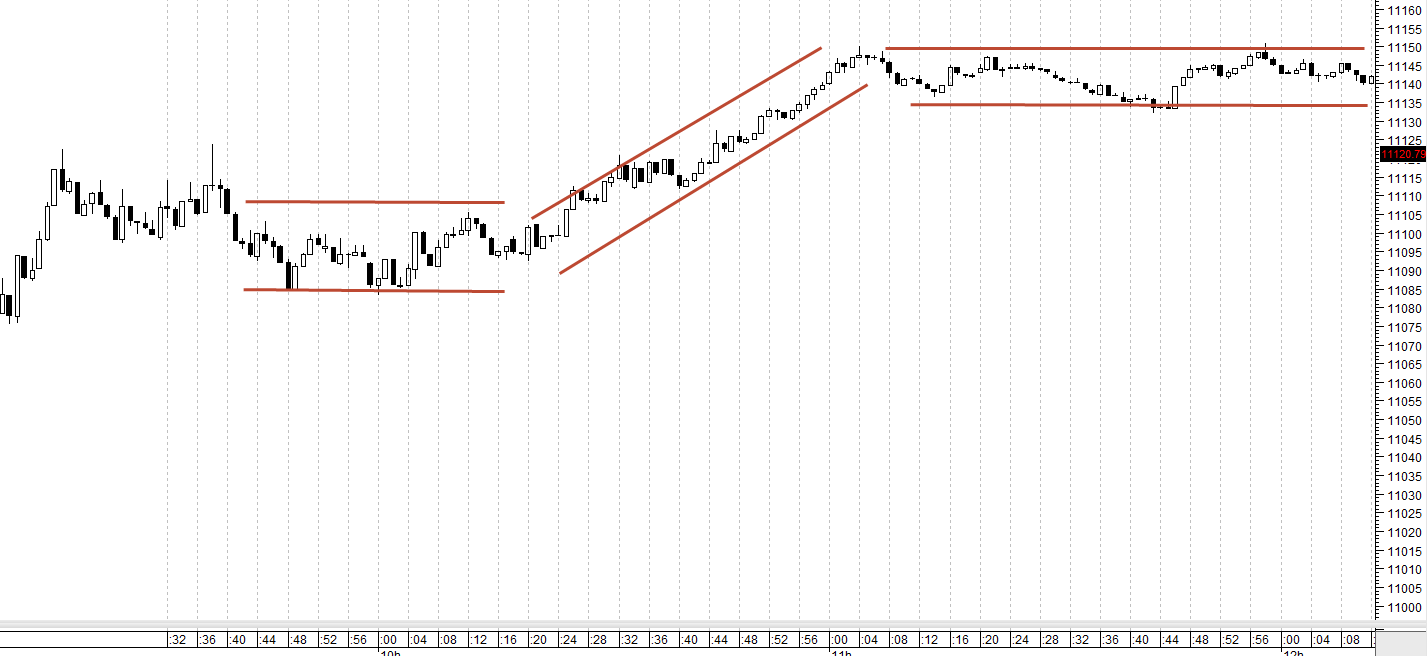
Here we see the first horizontal channel where the market is moving sideways in a range of 20-30 points in the German DAX-index. If this goes on for a long time, then many daytraders will try to find a trend and will quickly see that they are trading in and out of the market with small losers and a lot of transaction costs as a consequence.
After the horizontal channel, there comes a nice period of increases of about 60-70 points in total and this is where the daytrader can make some decent money by buying in the direction of the trend and follow it upwards.
But inevitably the trend will fade away and we will again see a period of horizontal price movement of about 15 points in total which we should avoid.
How do we spot a strong trend?
There are many ways to spot trends. But one of the most effective ways is to use the indicator called ADX or Average Directional Index.
The ADX indicator is an indicator that tells us something about how much “foot on the gas” there is in the market right now. I will not get into how it is calculated, but it is a pretty complex calculation.
But the first thing we need to do is to find out how strong respectively the buy and sell-side is. This is done by finding the two lines called Positive Directional Movement Index (+DMI) and Negative Directional Movement Index (-DMI). They can be seen on the chart below:
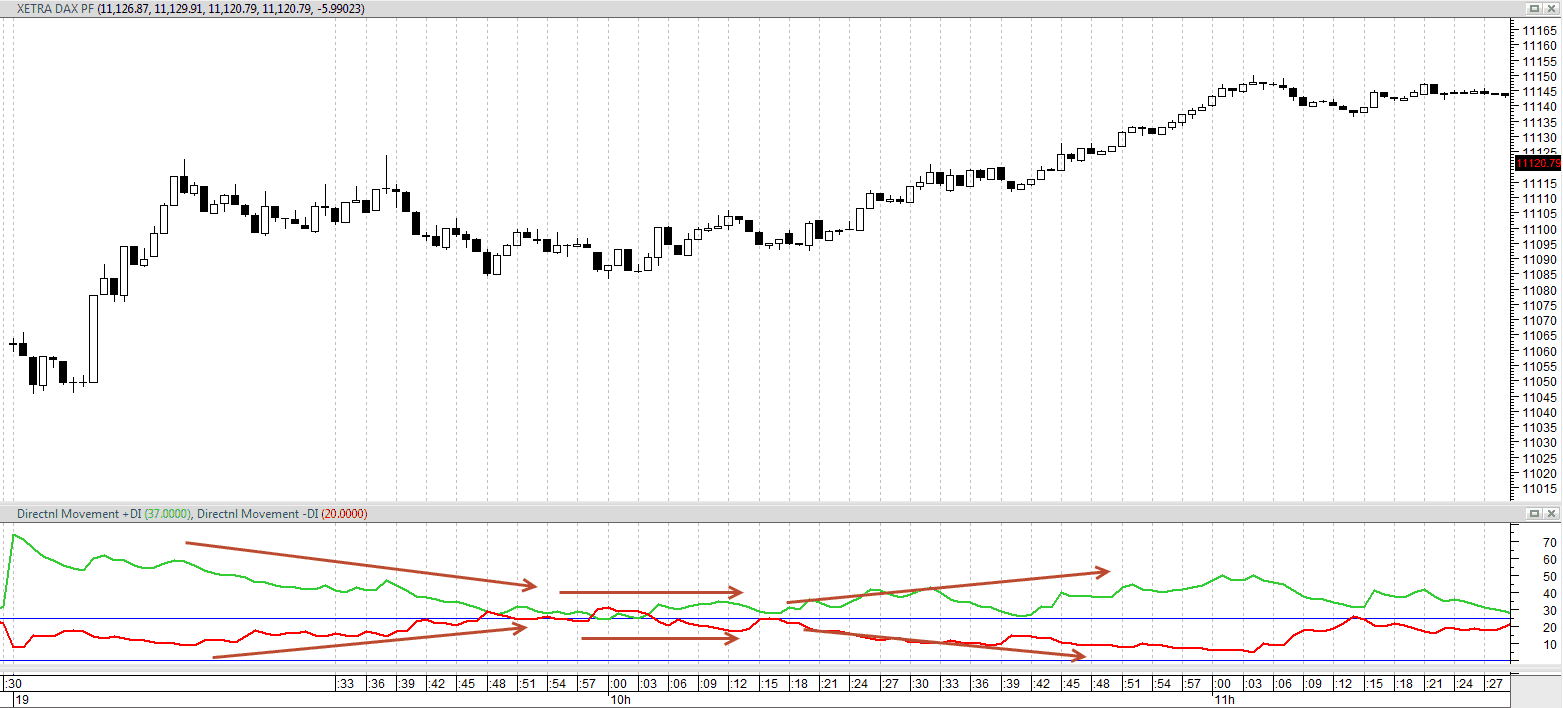
Here we see the +DMI (green line) and –DMI (red line) and see that first they narrow so they move close to each other and then move away from each other again.
When the two lines move away from each other, it tells us that the strength of the trend is rising. And when the green line is above the red, it is an uptrend and when the read is above the green, it is a downtrend.
Now come to the final calculation/indicator.
Using the ADX indicator for daytrading
The ADX indicator is a merge between the two lines which were described above.
When the ADX indicator is inserted on the chart it looks like this:
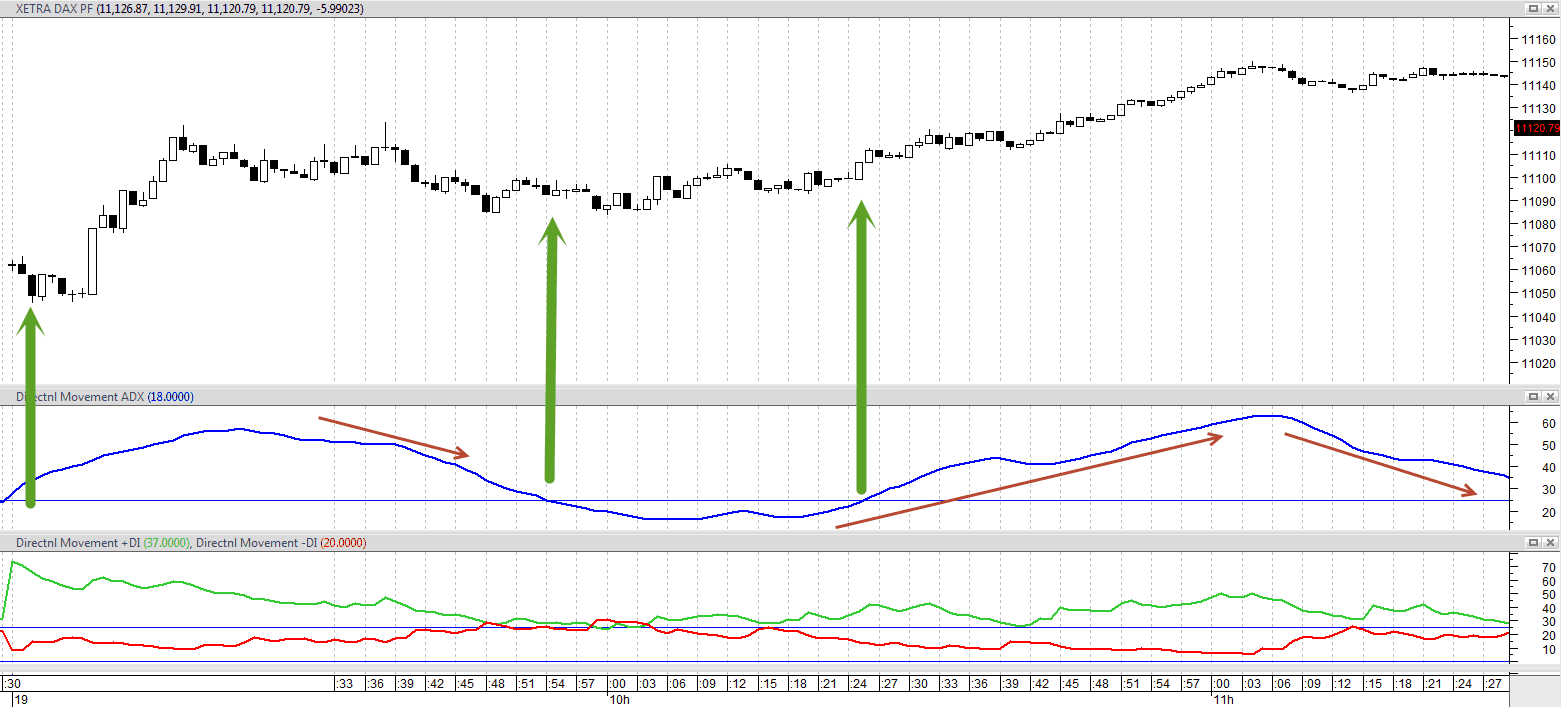
Here we see the blue line that indicates the strength of the trend. I have drawn a line marking out 25 and when the ADX is above 25 (and preferably rising) then we need to be ready to daytrade because the market is showing great strength.
When the ADX indicator begins to lose momentum and price is on a high level, we need to begin to be careful because we can easily get sucked into sideways channels that often can cost us money.
The ADX indicator shouldn’t act alone, but it is an excellent tool to have in your daytrading toolbox.
If you want to know more about the ADX indicator, then you can watch the videos below: