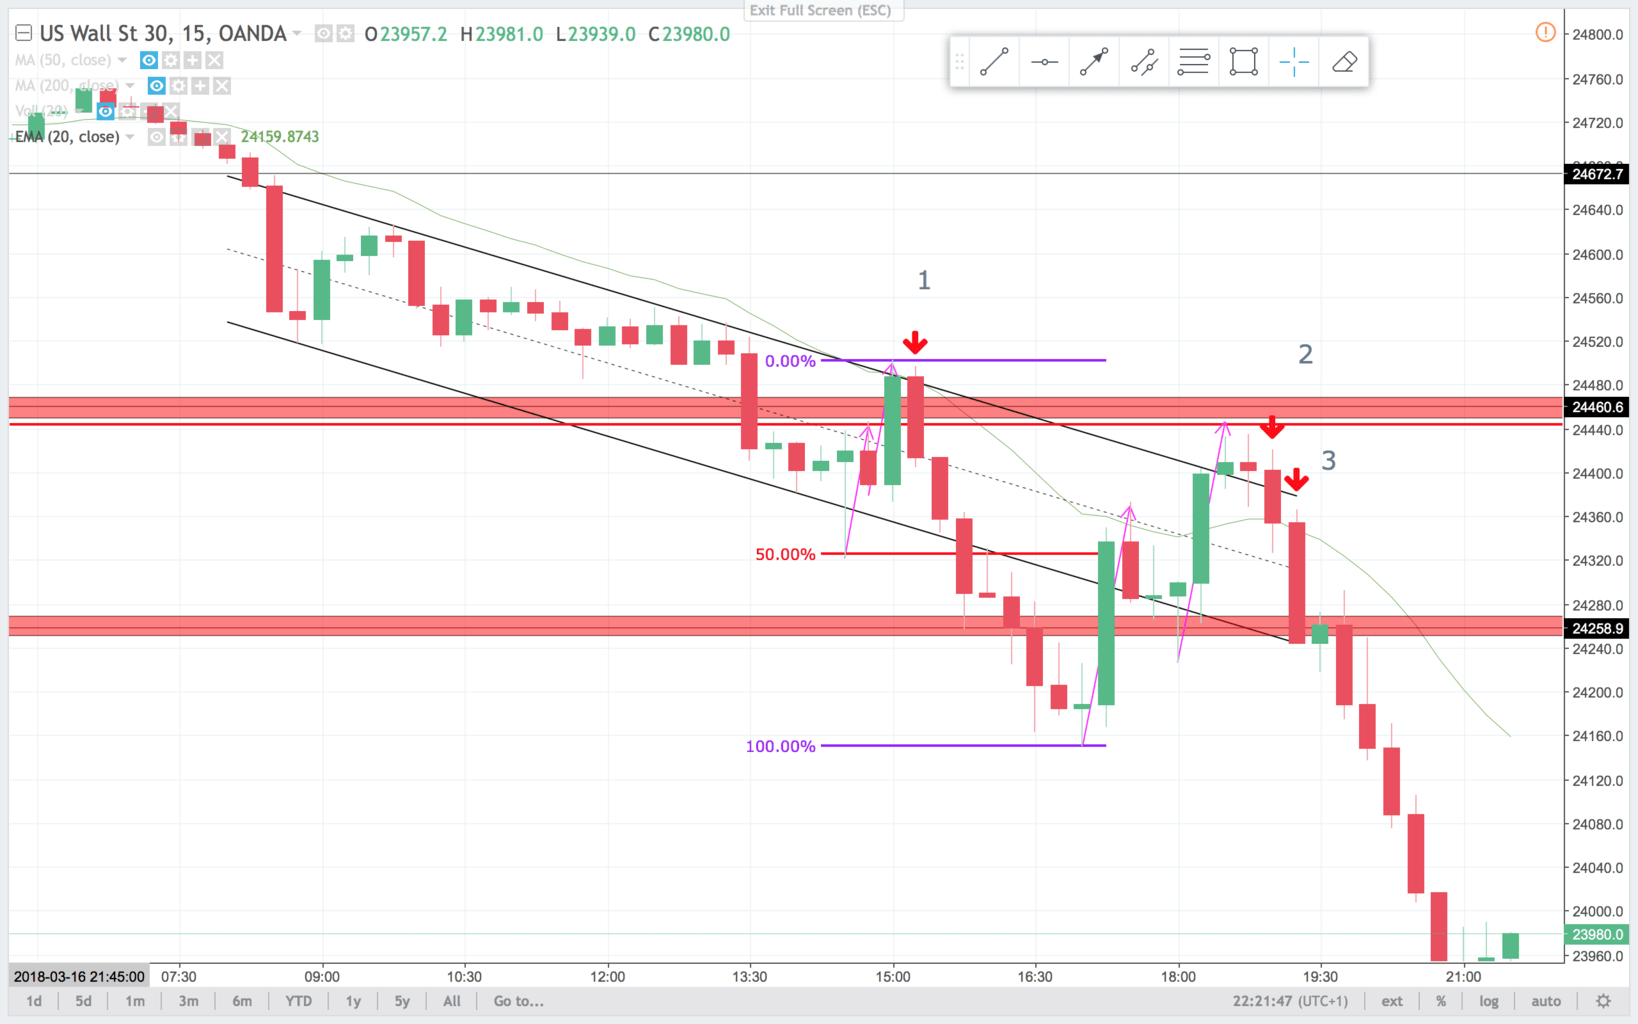
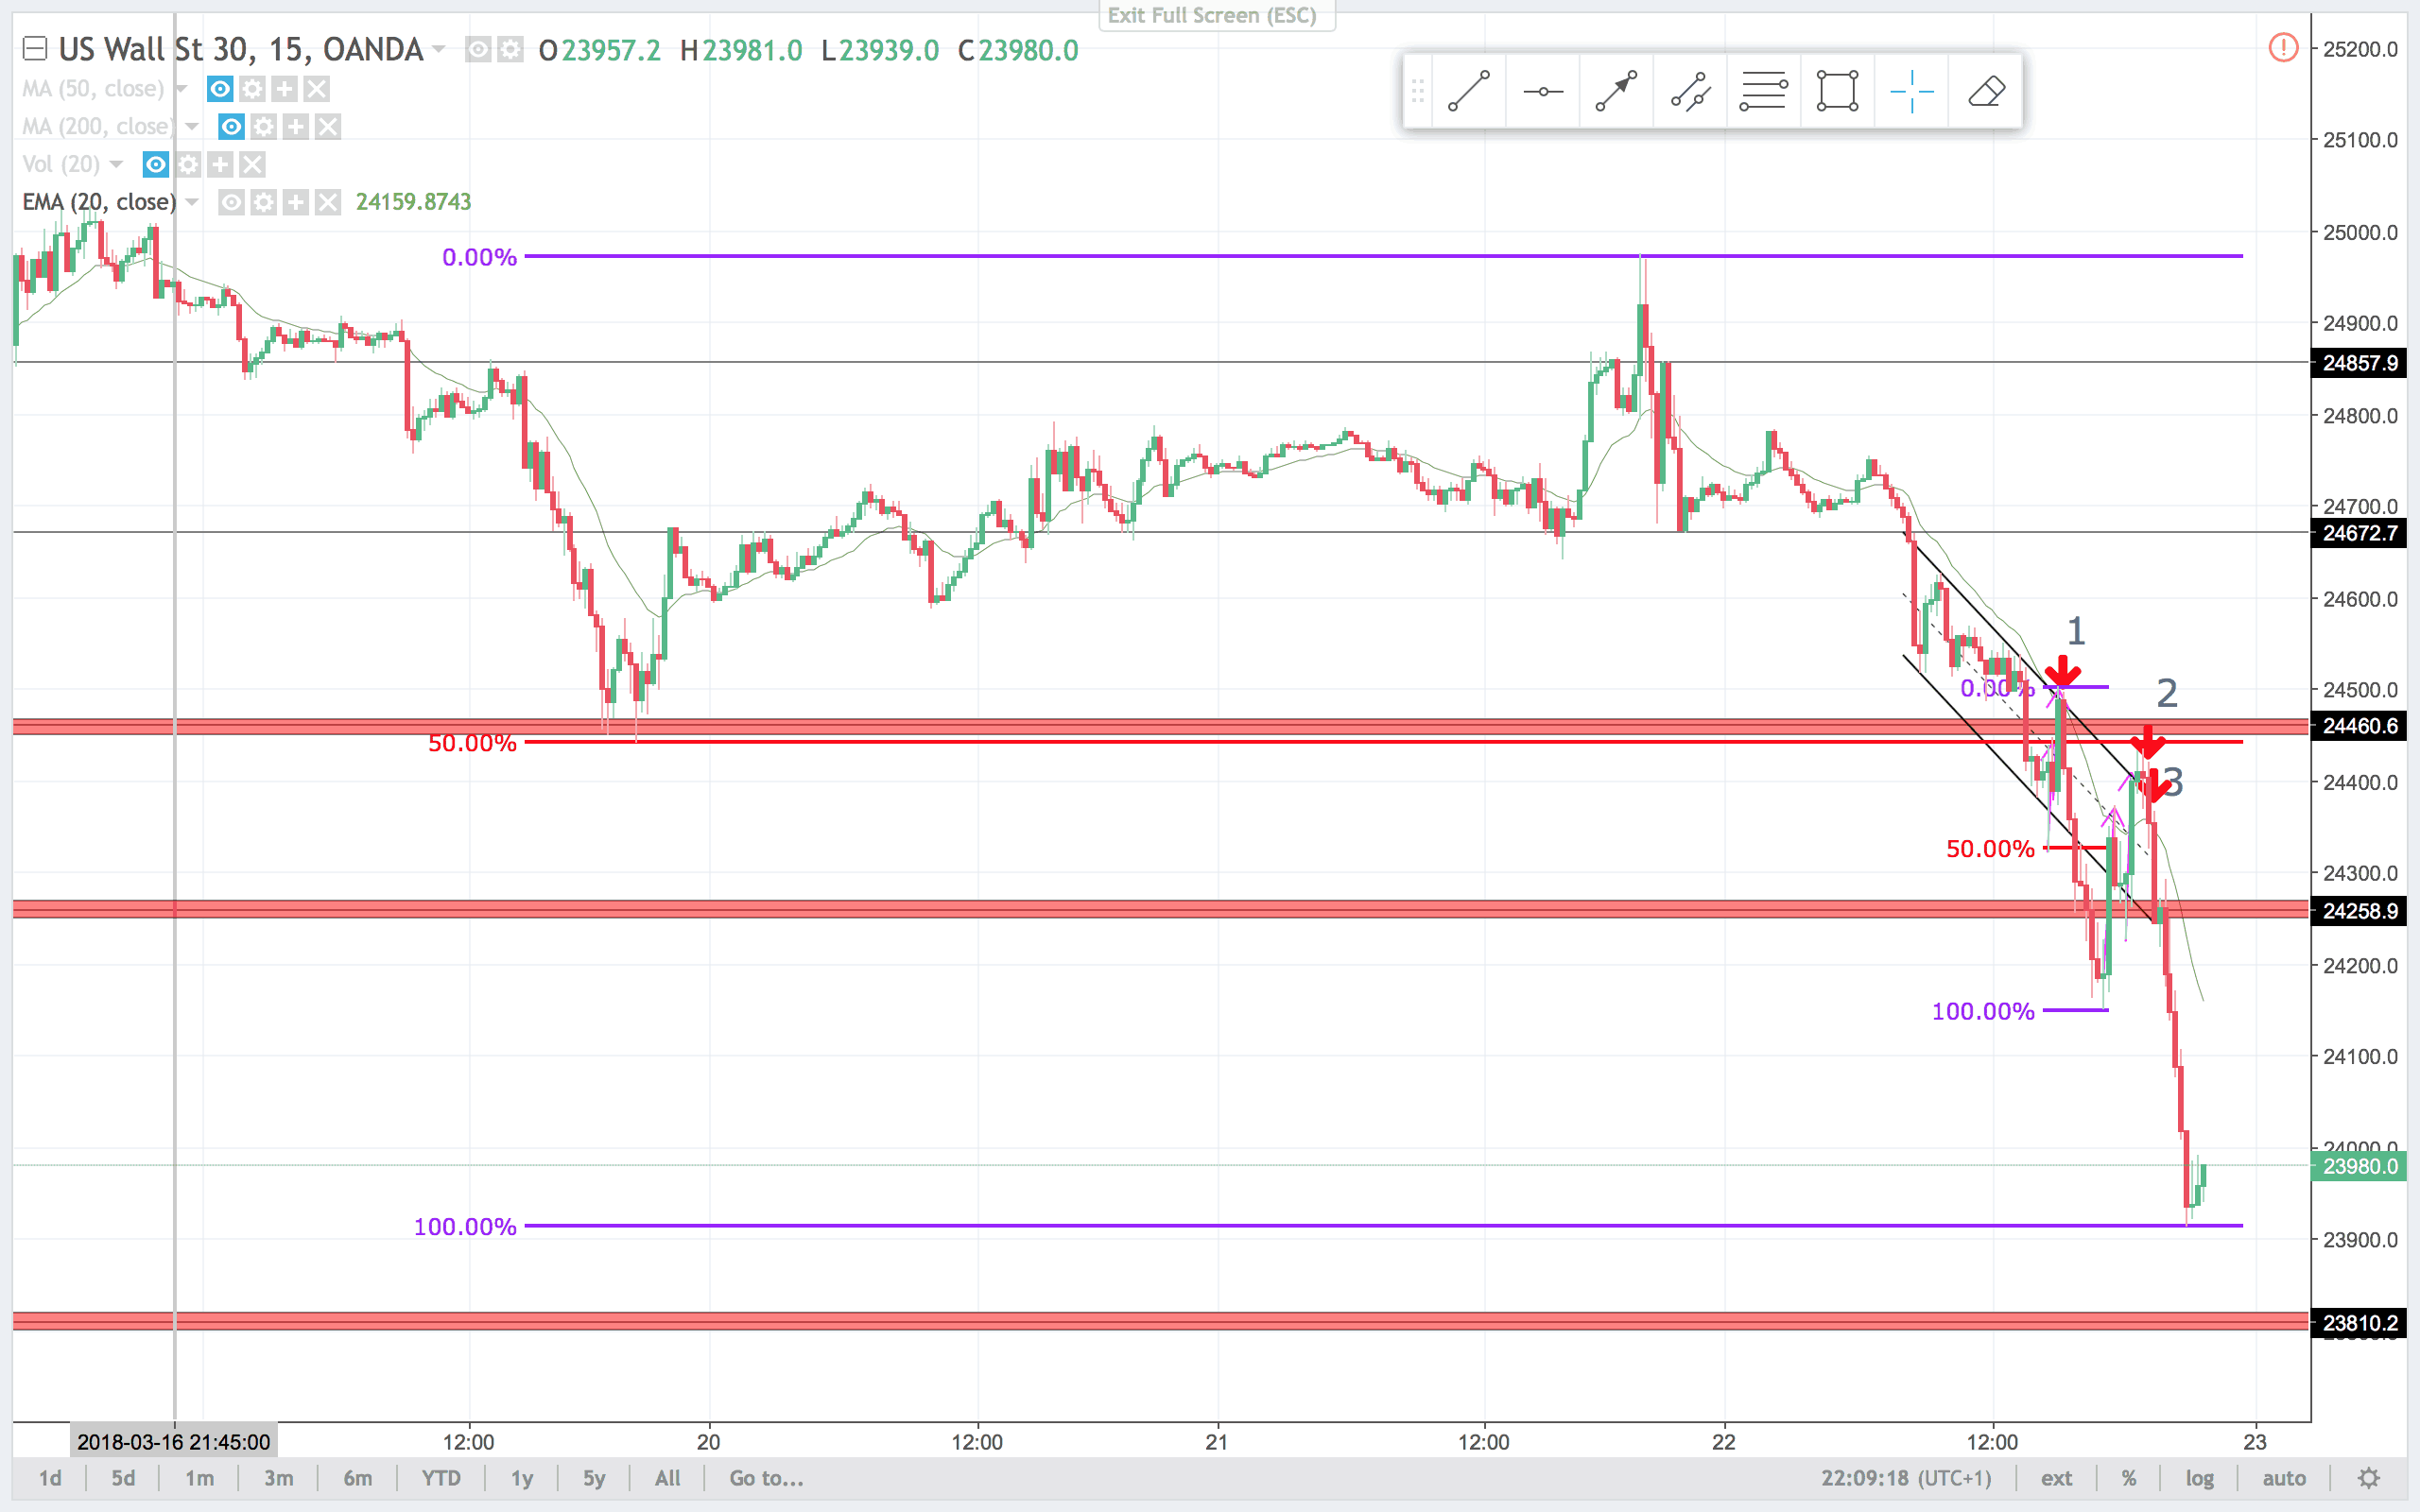
Hi traders. This week so far we had a bear BO(Break Out) to the support at 24.500 ish. Then a weak bull trend that ended with a exhaustion push to the area just below 25.000. From there price was trading in a TR(Trading Range) with support at 24.670 ish. When price broke below it gained momentum. Sellers kept selling any bounce, and in the end of the day we had a huge plunge to below 24.000! That was a final leg in the day with a almost 500 point drop! A lot of money to be made there. Let us take a closer look in the charts below. I marked three trades, only looking for sell setups on a day like this. Notice the 100% expansion on the larger 15 min chart. Same pattern occurred after trade 1.
1
On the 15 min chart price had broken support, and bounced back to the trendline. Nice sell signal bar, that also was a inside bar. The always in direction was down. so i like a setup like that for a short.
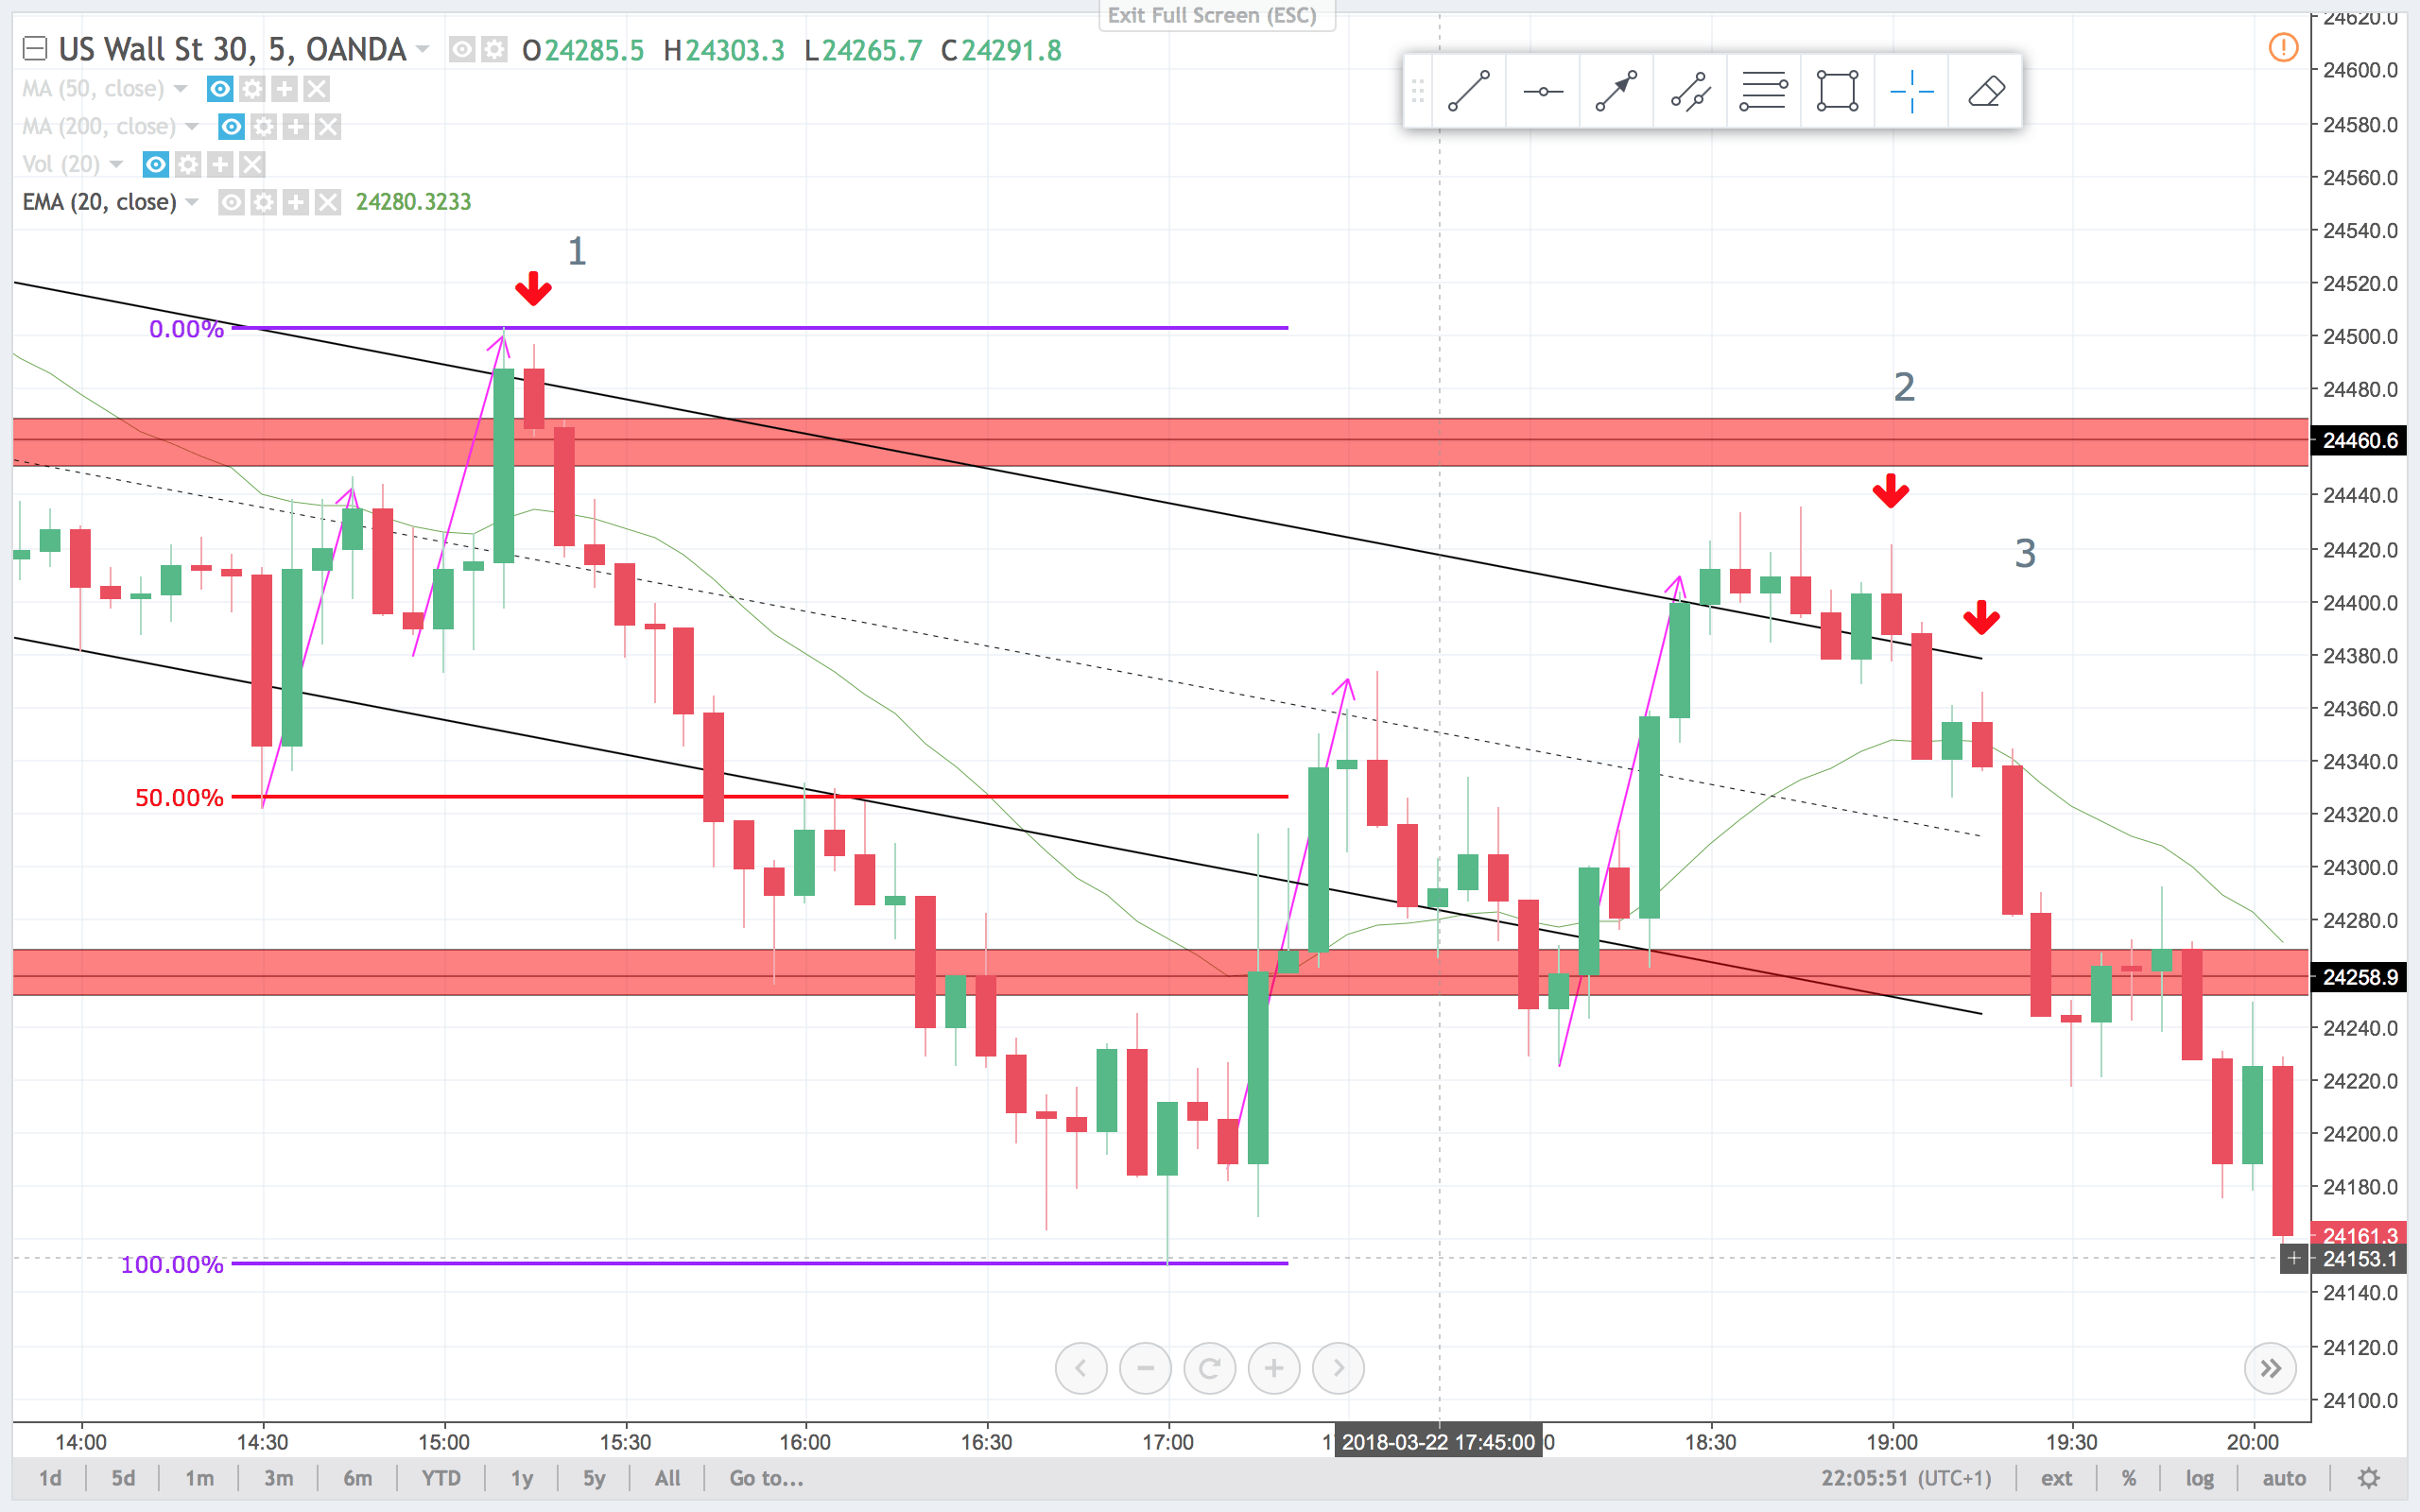
On the 5 min chart price made a perfect two leg correction and a sell signal bar. This setup was even at resistance. It just does not get much better than this. The target was a retest of the low at the 50% line, then the support at the red band finally a 100% expansion. If you look closely, you see a strong bear spike initially, then a smaller three push channel into the 100% line.
2
On the 15 min chart price had made a perfect two leg measured move correction. I like that pattern, even without a perfect signal bar. It is also known as a second entry short. Also it was a retest of the BO area from trade 1.
On the 5 min chart This was a lower high after the two legged correction. You could sell below all of the three bear sell signal bars at this high. The more the bull BO fails, the more likely it is, that bear strength will get tested again. Target was the support below, or the low of the day.
3
On the 15 min chart this was not a setup.
On the 5 min chart it was a lower high, BO pull back sell signal. When I am looking for sell signals in a market, I like these for a addon to my positions. Management point at a 100% expansion of the initial move. Or same targets as first position(in this case trade 2).
At the end of the day we had a bear BO of a TR. I think that the BO was so strong, that there is a good probability, that we will see follow through selling and lower prices in the time to come. I will look to swing my shorts and scalp my longs. A slightly less likely scenario is that this was a sell climax, and price will reverse from major support on the larger TF(Time Frame) chart. The daily chart had support at this area. If you look at the daily chart, there is also a probability, for a measured move down. That would take prices to about the 22.200 area. Have a nice trading week.