
The failed head and shoulder formation in DOW has hardly gone any daytraders by. The pattern was diligently divided into various forums and several wrote that it is now that the market is crashing.
Let’s take a look at a quote from Tom Dante:
“When everyone spots a head and shoulders, it will never work under any condition even if it’s the end of the world.”
In other words, when everyone expects the market to move in a certain direction, it will move the opposite.
Why does price patterns fail?
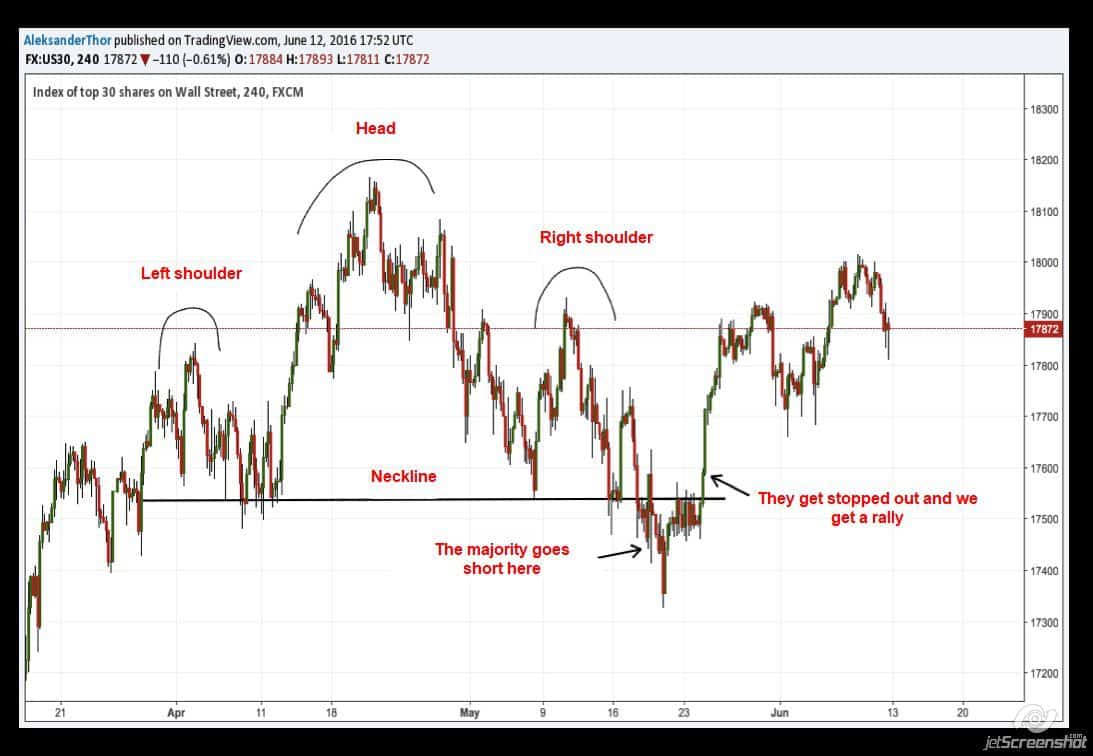
The following image of the failed head and shoulder formation in DOW brings together a lot of short orders at the break of the neckline. This creates a so-called Liquidity Pool, where market participants with more capital than retail traders have the opportunity to fill their orders. At the same time there are stop-loss orders above the neckline, and once they get filled, the market is rising quickly.
We are all biased
Therefore, as a daytrader, you should be aware that the classic and most obvious chart patterns often fail. However, this is most often ignored, as daytraders – myself included – suffer from a confirmation bias. We naturally notice all the times when we have confirmed that a head and shoulder formation succeeds, but ignores all the times the formation fails.
According to Tom Bulkowski’s statistics about Busted Patterns, about 28% of all head and shoulder formations fail. This is almost every third!
My own back test also shows clear signals that the head and shoulders pattern fails when there is a higher right shoulder.
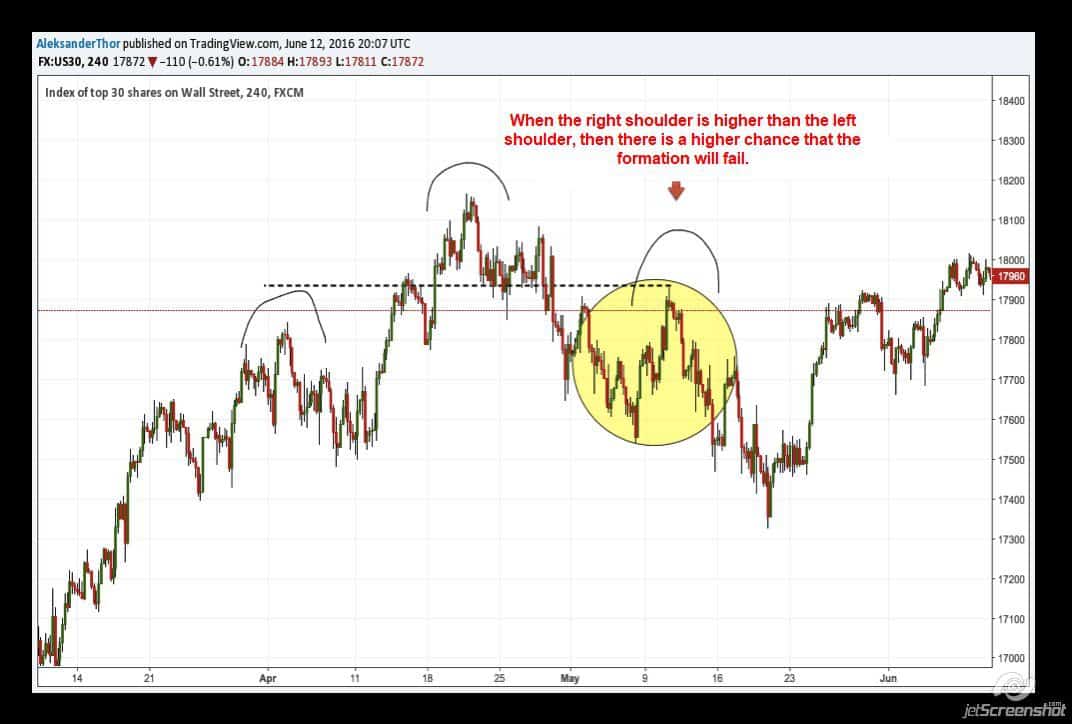
Below we have another example in DOW on the 4-hour graph. We see the same trend in the form of a strong rally after the market has tested the neckline. Notice the right shoulder.
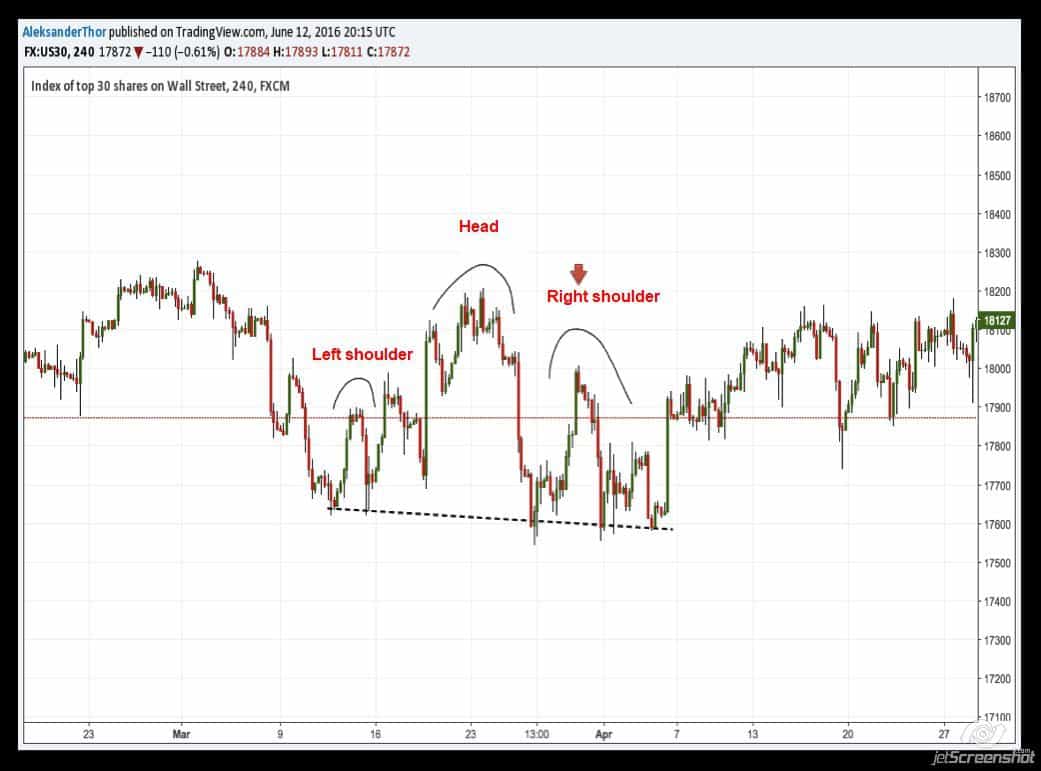
Another sign that the price pattern fails is if it occurs after an established bottom.
An example of this was after the sharp decline during the financial crisis in 2008, where we got a head and shoulder formation in the subsequent rise. Here, many expected another sharp fall, but the fall was missing and several daytraders were caught on the wrong leg.
It looked like this:

Summary
The message with this article is not to undermine classic technical analysis. It is certainly very good to learn and will increase your results with daytrading considerably.
But knowing the theory does not mean that the technique actually works in practice every time the price pattern occurs. As we saw above, statistics show that, for example, the head and shoulder formation only works 72% of the times. But if we are aware of the situations where it most often does not work, we can still get really great success with the price pattern in our daytrading.
The reason that the price patterns fail is just not that the theories behind the models do not work, but the simple fact that when all daytraders look at the same price pattern and expect the same result, we have to be prepared for the opposite. This goes into the industry under the phenomenon of Contrarian Trading:
“Put simply – if you follow the herd, you will be led to the slaughterhouse” – Investopedia

Video
Below is a video that elaborates on the article and comes with several examples.