In the last video I talked about the probability of a trading range developing this week and that is what we got. Did I know that? Of course not, but it is a pattern I have seen before, and it has a good probability of becoming a trading range. First we had a rare reversal on the low of the week. A reversal with no clear test of the low. Known as a “V” reversal. Hard to get a setup in that case. Going long at support would be like catching a falling knife. Price rallied up to resistance but could just as well have pushed lower. At the resistance price made a nicer reversal pattern with three tops. I found some nice trades to talk about yesterday and one today.
It can be necessary to zoom in on the charts to see the details.
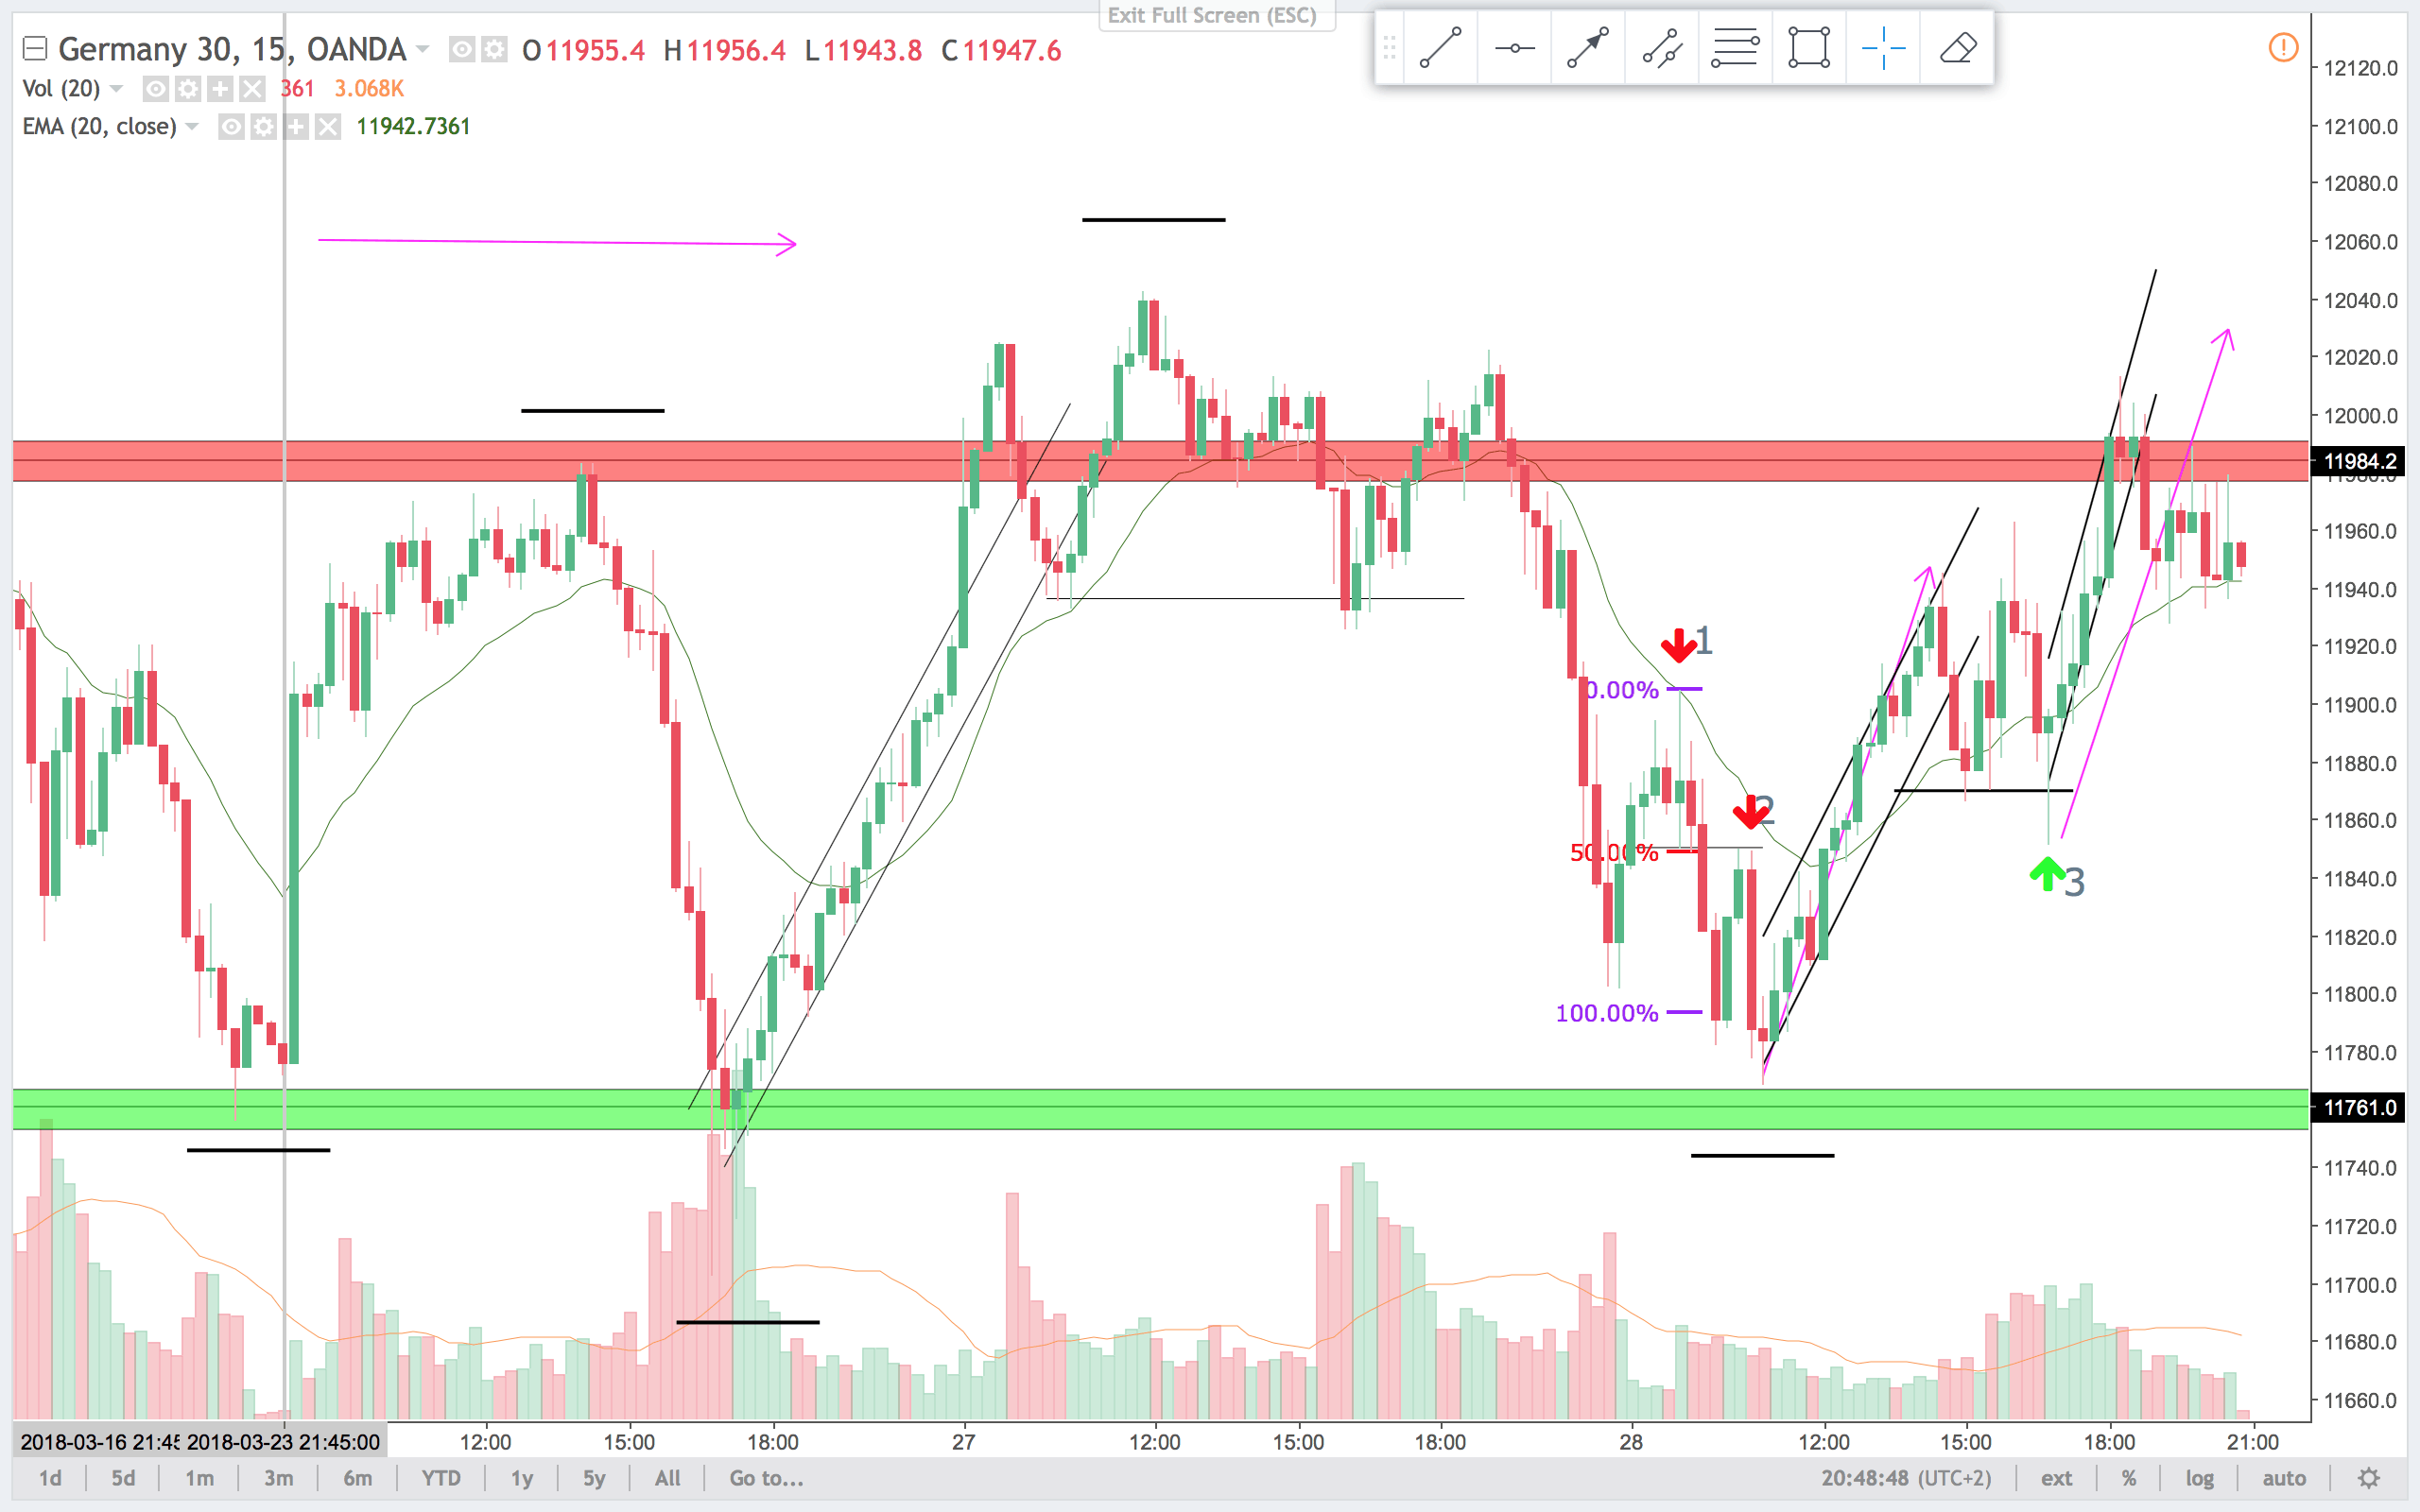
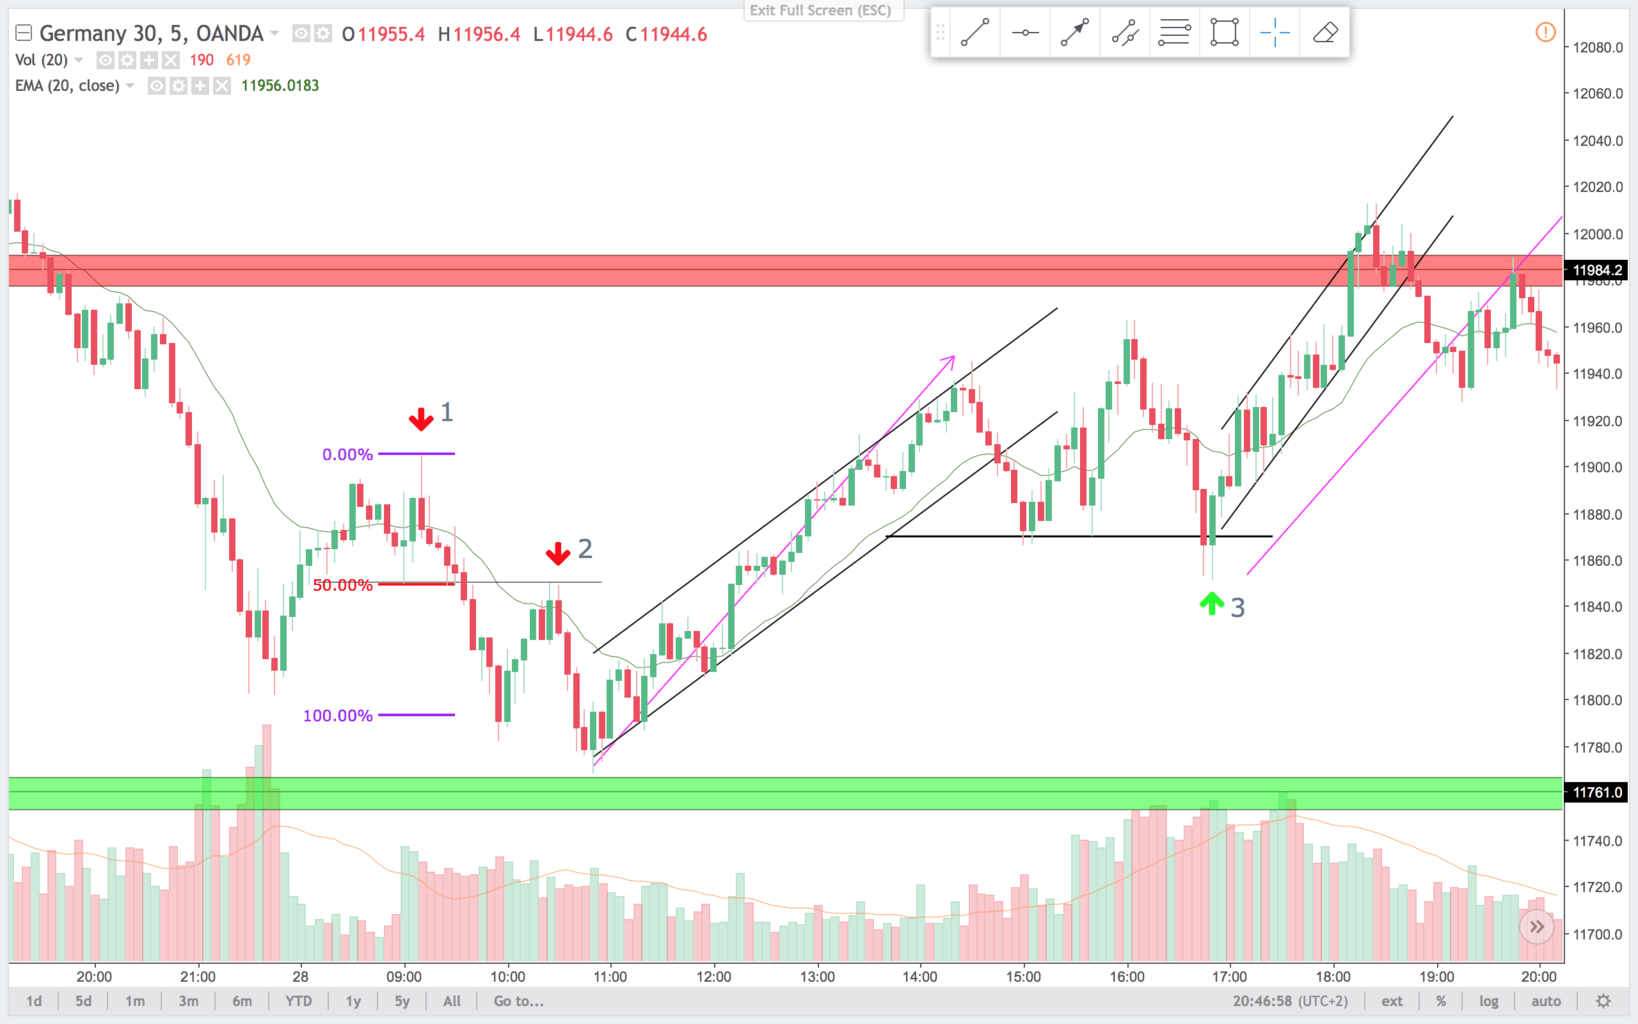
1.
On the 15 min chart, there is strong momentum down. Tails above and we still haven’t had a retest of the low. Look at the high tails above the bars before the entry which is a sign of selling strength. Also it is approximately a 50% retracement of the larger bear leg.
On the 5 min chart, this is a failed break higher. Nice bear bar closing on the low. This pattern formed just as the market opens, could be a high of the day and a bear trend day, so I like this for a short, and a swing trade.
2.
On the 15 min chart it is a 50% retracement of the bear leg from trade 1, and a retest of the BO area from 1. There is no signal for the trade on the 15 min chart. So you would have missed this trade, if not aware of the lower time frames.
On the 5 min chart, this is a common inside down bar in a bear flag. It is at the EMA and a high probability trade in my opinion. It is a retest of the BO area from open range. Good trade but your runners would not have gone far. Price reversed after 11 o’clock. Common time for the DAX to begin trending. Also look for trends at the US open.
3.
On the 15 min chart, this is a nice second leg correction. The correction range expanded to first be a failed break higher(nice sell signal there also not marked). Then a failed break lower. Long tail below, closed near high of bar. Nice setup for a test of the resistance above. Perhaps a second leg up like the one from the low after trade 2.
On the 5 min chart the failed break lower is super clear, and the price almost mad “twin” bars. This is a two bar reversal pattern. I like that for a long. Also it is a second entry long.
Breakouts can fail to both sides like in the 3 setup. You can easily get on the wrong side of the market. If that happens, minimize your loss and wait for your next edge to appear. And yes, it is easier said than done. Patience and waiting for the patterns to form is the hard part. Have a nice trading week.