By Claus Andersen
Large reversal pattern on the 60 minute time frame. This is a classic pattern that is worth learning to recognize. It is seen on all time frames, and I mention it often.
60 min chart:
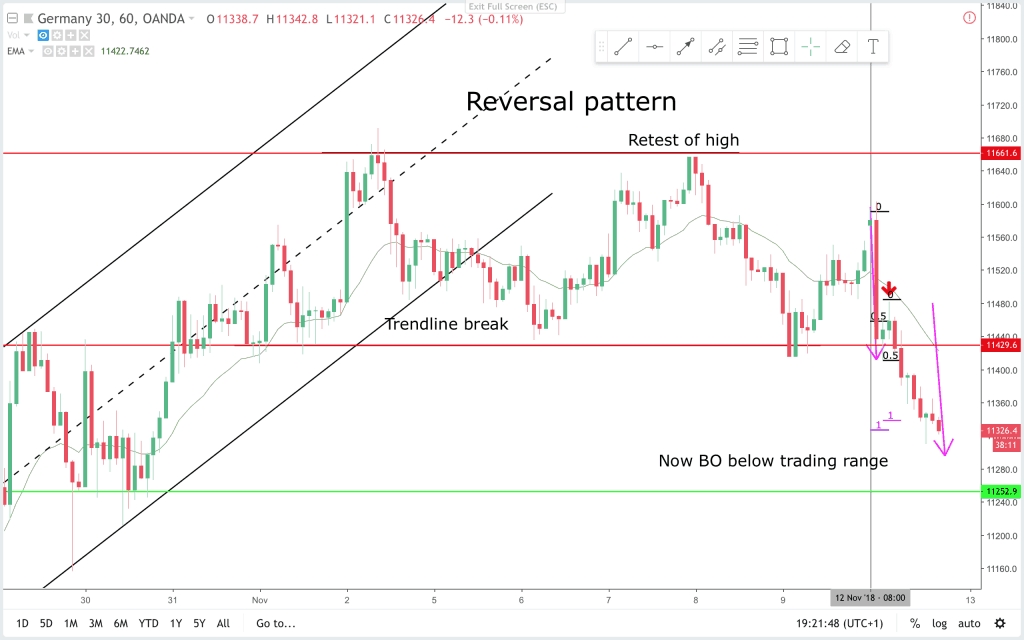
Here is a short description of how the pattern outfolded. When there is an established channel. In this case a bull channel. Then it is a bull trend. At some point price will break the trendline. After the break, often price tests the prior high. This is a crucial point of the pattern. Context of how strong the bears or bulls are in this phase adds or takes away from the probability of the reversal succeeding. Three outcomes are possible. Either price breaks higher and the pattern becomes a flag and continuation pattern. Or price trades sideways and enters a trading range. Third is a break below the low that broke the trendline, and then the reversal is underway. If successful price often makes a 100% expansion of the upper range.
Today i picked two trades to point out. The green and red lines are support and resistance areas I’ll look to trade of in this week.
1.
15 min chart:
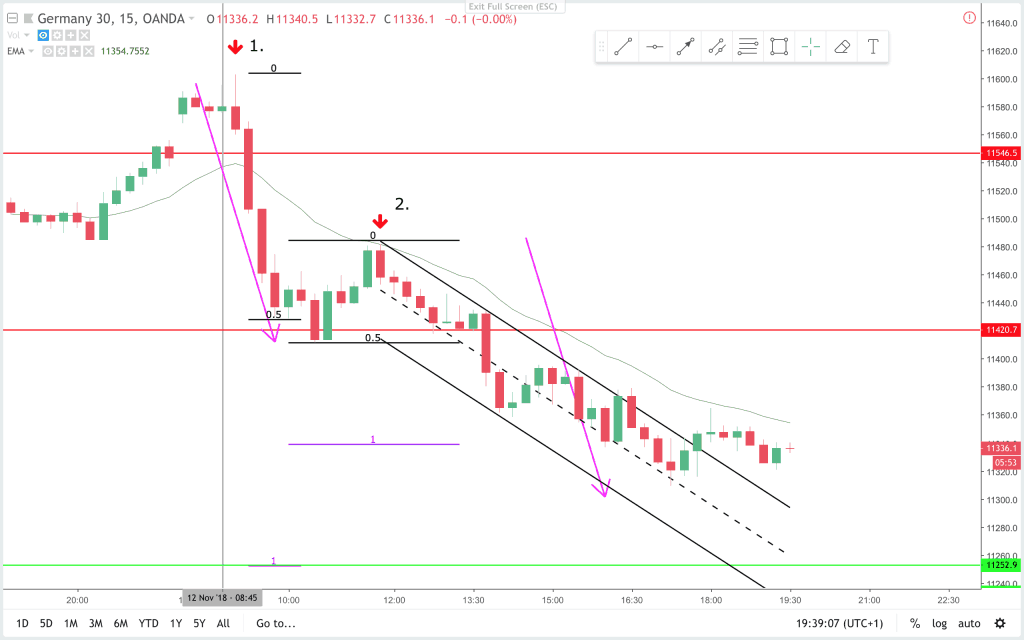
On the 15 min chart price made a gap up on the premarket open. The open bar was a bear outside down bar. It closed on the low and was a good bar for a from the open bear trend. As it turned out, the day was a bear trend day.
5 min chart:

On the 5 min chart this is not a perfect sell from the open. But the signal bar and following inside bar was a sign that bears was in the market. After the last days reversal pattern this could be a lower high in the larger pattern. The sell signal here was the same as on the 15 min chart. (That I liked better). Context was good for a sell.
2.
On the 15 min chart this signal bar traded higher first then closed on the low. It bounced right on the EMA. After the morning sell off, I was looking for a reason to get short. This is as good as any. Problem was that price bounced on support(red line), and it could be a reversal up.
On the 5 min chart this is a really good signal. After the sell-off on the open you are looking to get short. This is a two leg correction(almost a measured move) and a small bull spike and wedge pattern. It completed on the final bull bar. A failed BO above prior two highs. The bear signal bar closed on the low. Price never testet the entry area for this trade, meaning bears were strong.
These reversal patterns are really important to price action traders. I have studied countless charts, and this is recurring patterns.
Claus Andersen