By Claus Andersen
15. April 2020
15min chart:
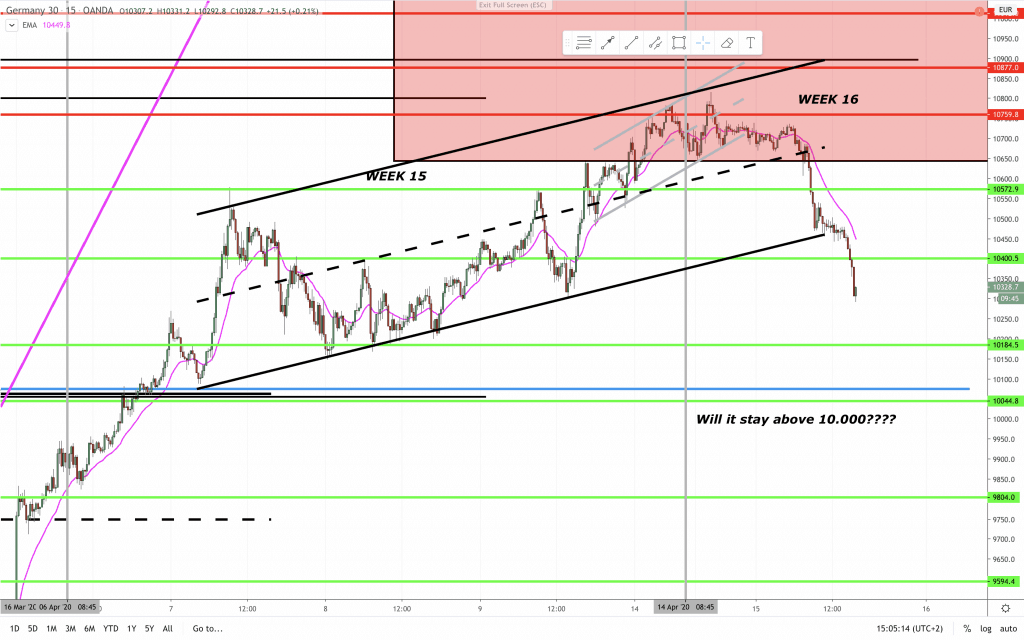
LAST WEEK: “The red square could be a nice area target area if long. Or a place to go short it the right price action setup formes. If price fails to reach the measured move target it could be a sign that we are going lower.“
Looks like we hit the nail on the head again. That short call was nice. Now what to do? Price is likely to test the BO area from the blue trading range first. Then what? That depends. The bears look strong on this 4 hour bar chart. The 10.000 mark could be the magnet. Closes below the EMA and 4 hour bars closing on or near the lows is very bearish. I could doubt that price will sell down at test the low from mid March. Potential trending trading range context where price will trade sideways forming a range just to make a small break at trade into another trading range. Price turned at the 100% expansion of the minor black trading range. That means that algorithms are trading this.
240 min chart:
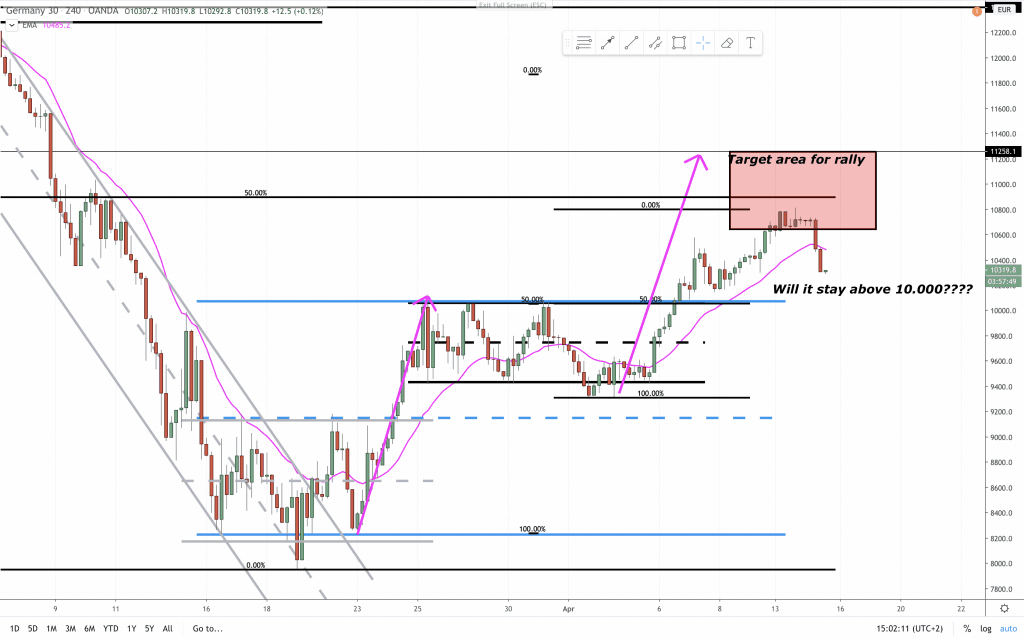
LAST WEEK: “I do not like the hesitation and would like to see the follow through to the upside soon if convinced that we will stay above 10.000. “
The follow through was not strong enough. Bears get another chance. That tells us, that large scale traders are still willing to sell. Look for measured moves, and price to react at support. Key area for the DAX (GER30) is the 10.000 price area. If bulls can’t keep price above that area, then potentially a test of the blue midline or lower.
A bit more detailed analysis in the video below.
Support and resistance was adjusted in the latest YouTube video:
If you are not following us already on FaceBook here is the link: