By Claus Andersen
4. March 2020
15 min chart:
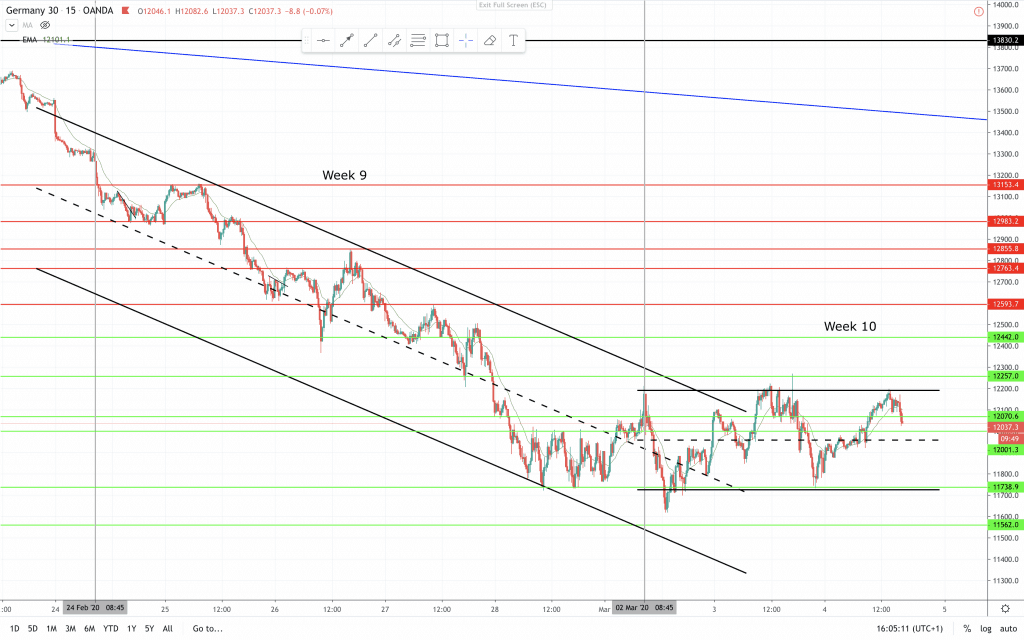
// DAX 1-2
The bear sell off took price below 12.000 all the way to the 11.600 area. The last move to the channel line was a exhaustion move and shortly after it broke the trendline. Now the context has changed to more of a trading range context than a bear trend. I would still bet more on the down side than the upside. Probability is probably around 65% that we will get lower lows. But still price action works out for us. Selling at resistance and managing at support. When volatility is this much I skip more setups due to large stops. But when I take a trade I expect at least a 20 point scalp, where with normal volatility I go for 10 points. Trade smaller if risk is larger.
Weekly min chart:
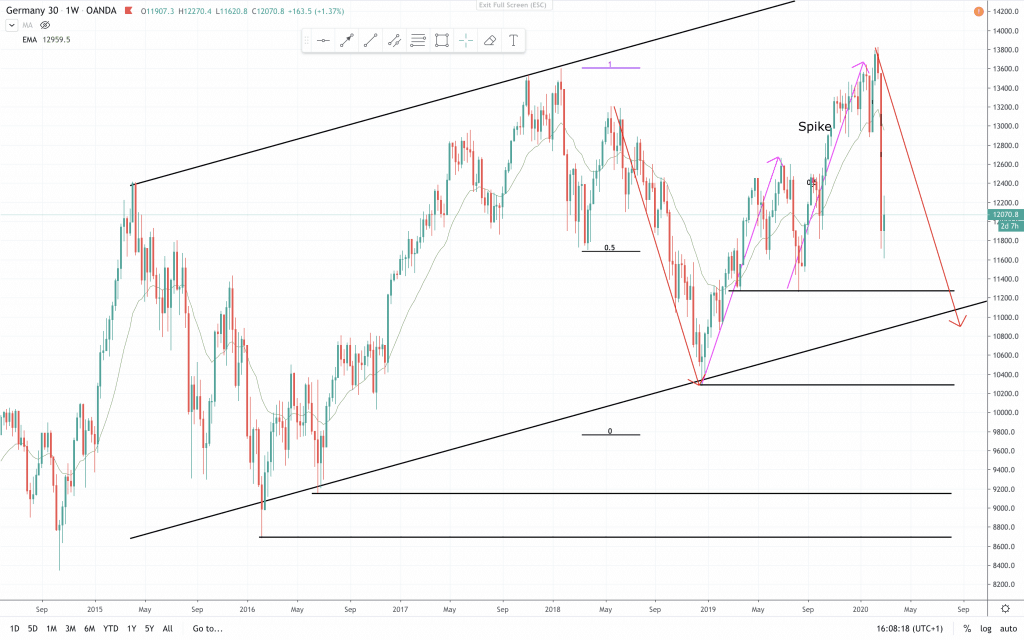
To get a larger perspective on this drop in the DAX (GER30) I took a look at the weekly candlestick chart. We have some clear prior lows(horizontal lines), where we might see buyers step in. Price is still in the major bull channel, but if we fail to reach the channelline above, then we could see a break of the trendline. That would mean a drop below 11.000 or a long time trading sideways. A test of 10.000 is not unlikely from a technical perspective. Time will tell. I am piling money to put into long term investments when I see a bottom formation. Also I am borrowing money for real estate while rates are low.
Trade smaller and more carefully when volatility is this high.
A bit more detailed analysis in the video below.
Support and resistance was adjusted in the latest YouTube video:
Let’s level up together 📈
Claus Andersen
AIL = Always In Long
BO = Breakout
FBO = Failed Breakout
PB = Pull Back