By Claus Andersen
1. April 2020
240 min chart:
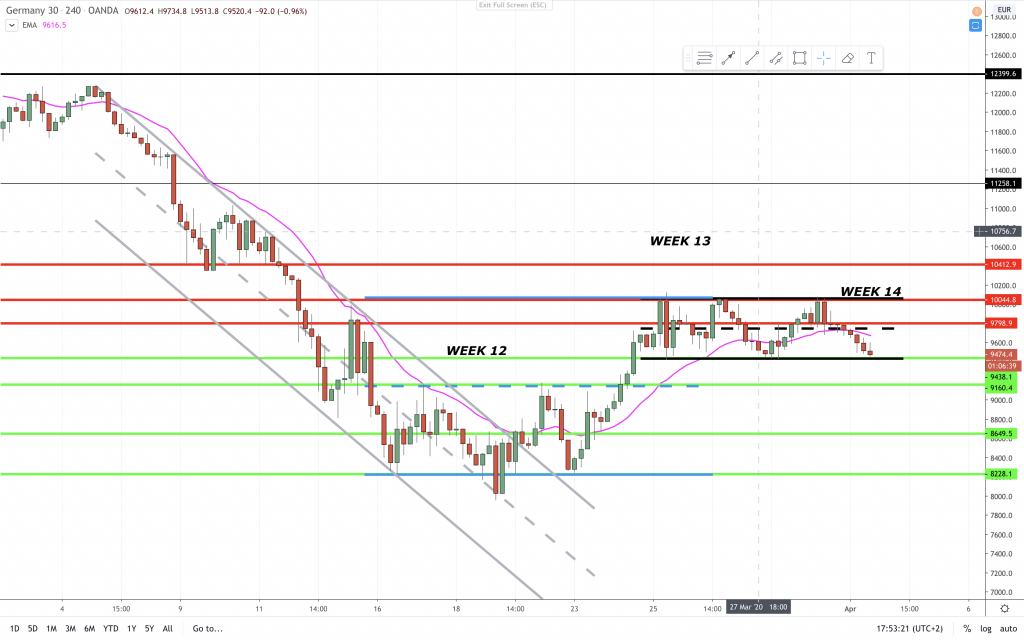
Last week: “The push up was strong enough that we might get another high near 10.000 but it will be exciting to see what the market does as the news gets worse over the next couple of weeks.” – Price made a triple top at 10.000. Followed by a drop to support every time.
We got the push to 10.000 and followed by a selloff towards the low of the range. Two trading ranges are in play right. The small black one between 10.000 and 9.500. And a larger one with the same resistance and a low at 8.000. It is early in the Covid19 (Coronavirus) outbreak to call the bottom. I have begun to buy a bit for the long term portfolio. +15 years horisont.
15 min chart:
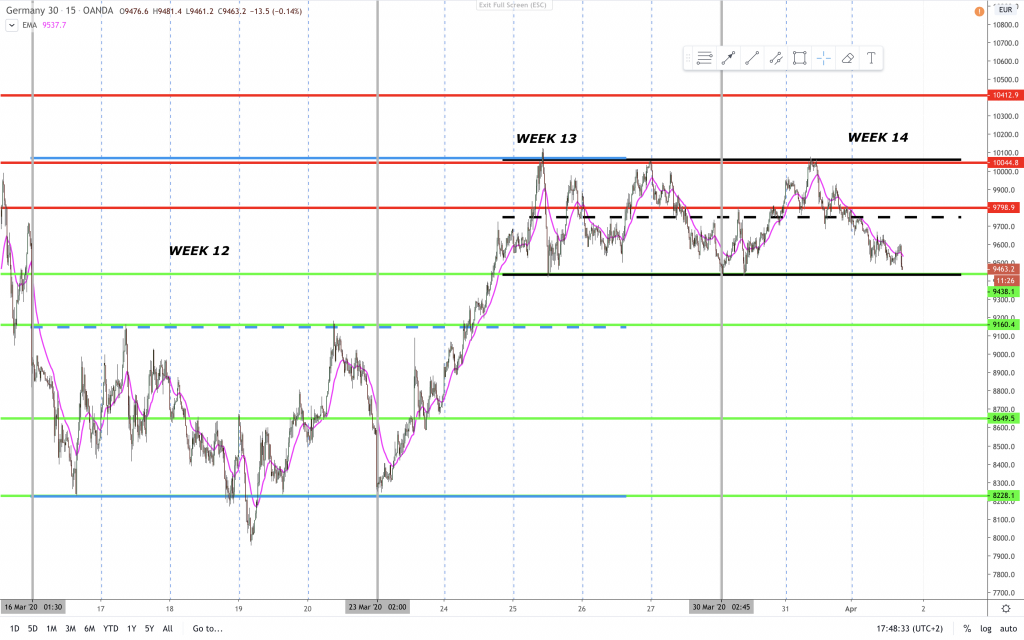
Two trading ranges in play. The upper black range and the larger blue range. The DAX (GER30) has traded sideways for so long now(relative on this 15 min chart), that the direction right now is 50:50. Then the major trend takes precedence, and that trend is down. The push higher was initially strong, but bulls could not get it to stay above 10.000. And if price breaks below 9.500 and get follow through, I would not be surprised to see an attempt at the lows again.
A bit more detailed analysis in the video below.
Support and resistance was adjusted in the latest YouTube video:
Let’s level up together 📈
Claus Andersen
AIL = Always In Long
BO = Breakout
FBO = Failed Breakout
PB = Pull Back