By Claus Andersen
- December 2019
15 min chart:
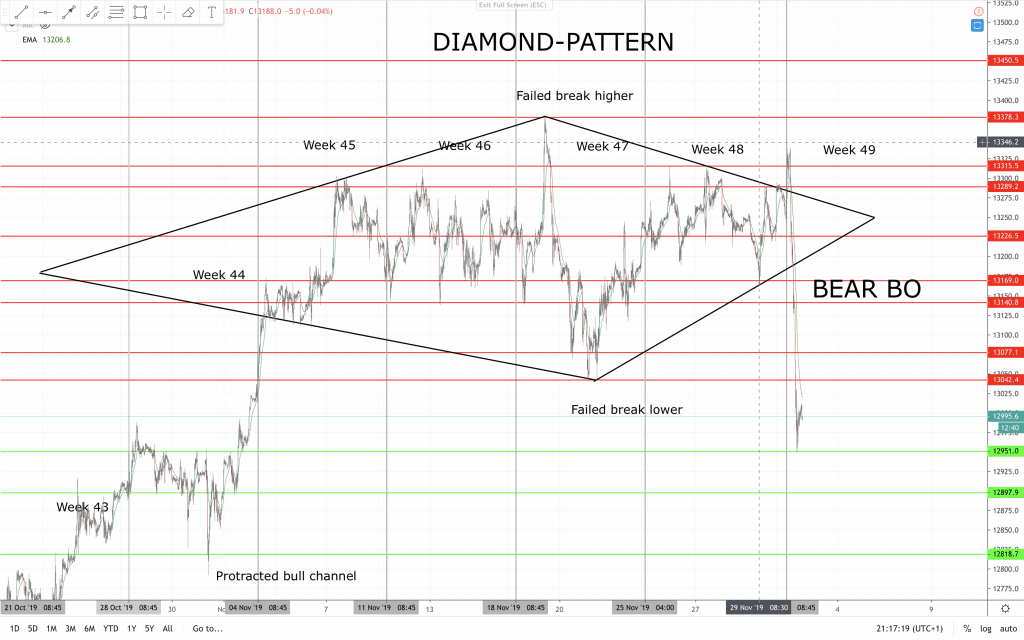
Diamond pattern:
Price action patterns are patterns that repeat themselves over and over again. They do not always give the same outcome, but you know that at the end of a pattern there will be a move. That means that there is a good risk to reward in either direction. Even if you always chose to always buy a completion of a pattern and only get it right 50% of the time you can win. As long as your risk to reward is better than 1:1. Often after a BO from a pattern price moves 1:5 or more. That was the case for the diamond pattern break out we had today. The risk on the doubletop was about 21 points and the reward was +300 points.
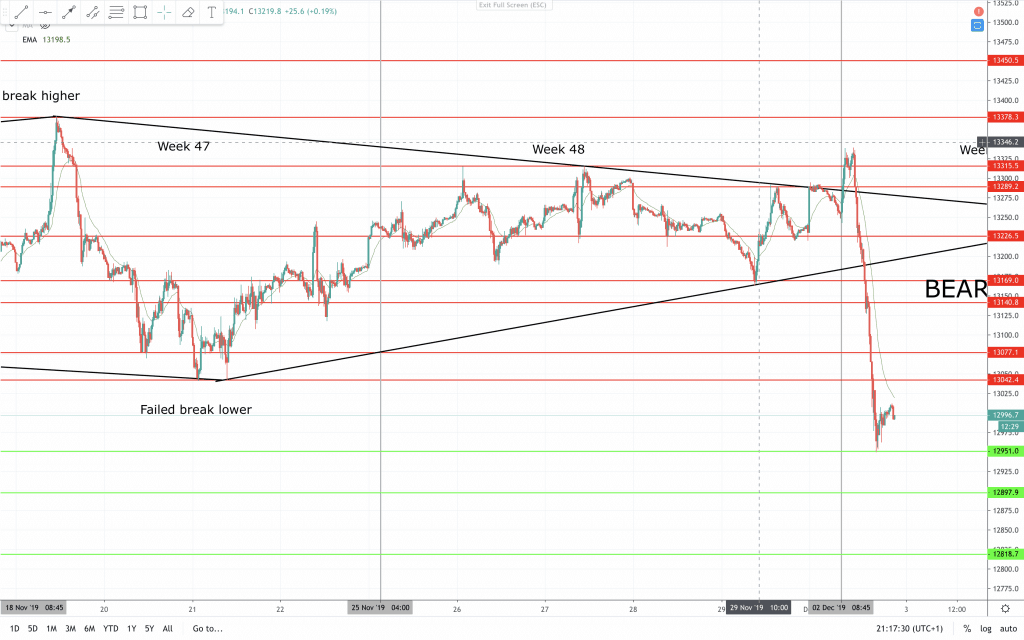
Price has moved down and new support and resistance lines was necessary. On the chart above I share the areas that I will use for my trading this week. Price is now always in short, and I will be selling rallies.
Price action support and resistance areas for intraday trading this week are adjusted in this chart. You can see the process in the latest video on YouTube!
Have a nice trading week.
Claus Andersen
AIL = Always In Long
BO = Breakout
FBO = Failed Breakout
PB = Pull Back