By Claus Andersen
26. November 2019
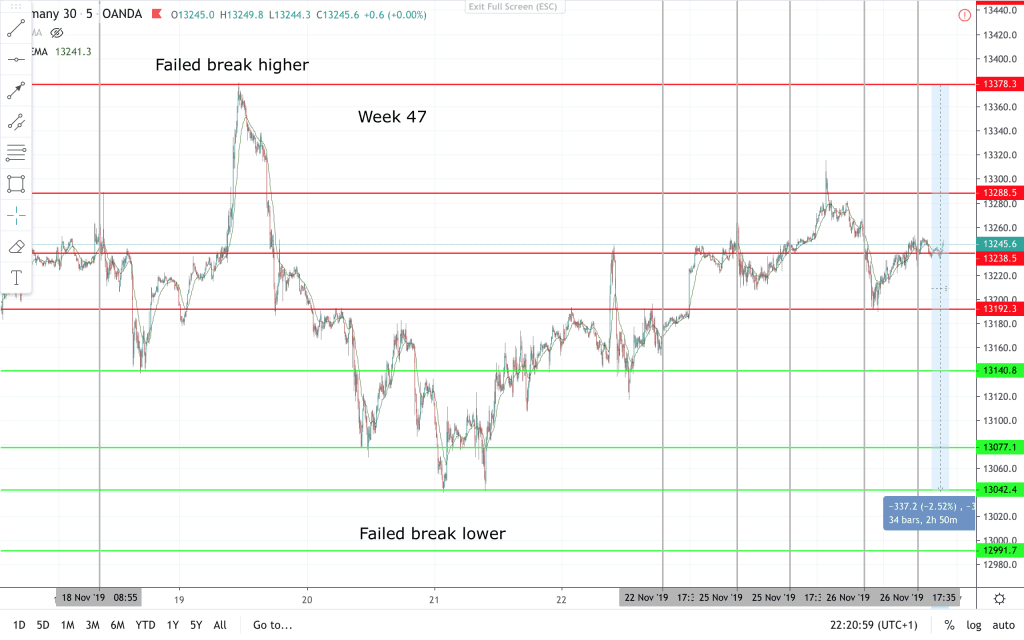
15 min chart:
Last week I wrote about the DAX / GER30:
”All breakout attempts failed and price is still within the trading range. The chance of a breakout is around 50% in either direction. Probably expect a trap in the opposite direction before the BO happens.”
Price action started this week with a FBO to the upside and then pushed out the bottom for a FBO the the downside too. This is a diamond pattern. All we need to watch is the contraction of price and trade it like a triangle pattern.
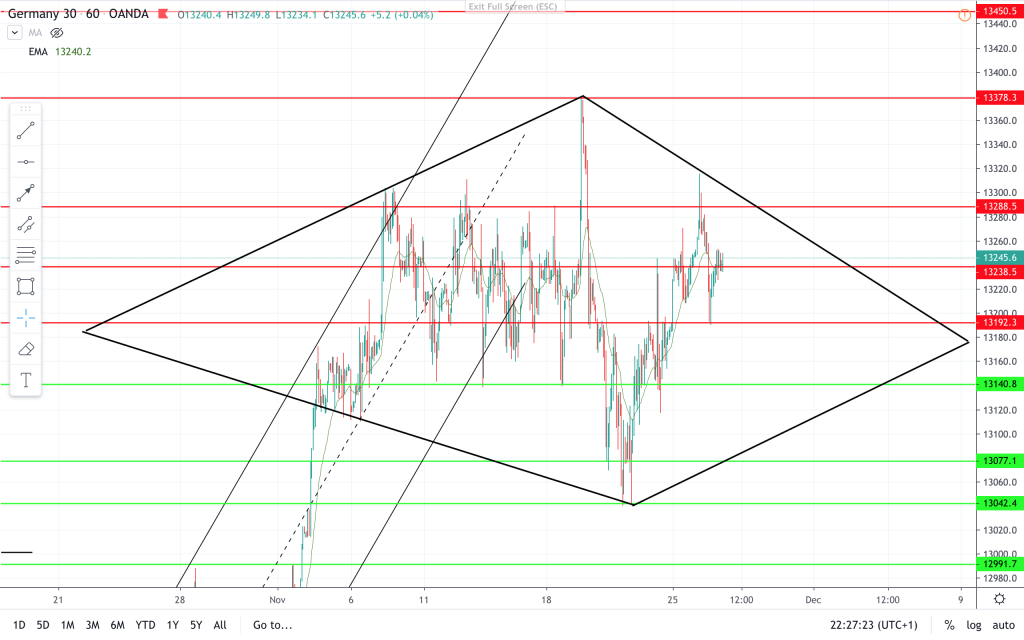
Diamond pattern:
Price Action pattern reading takes practice, but is not hard to learn. Any questions are welcome. Or follow the link to our Facebook or YouTube page to see more price action and candlestick chart analysis.
Price action support and resistance areas for intraday trading this week are adjusted in this chart. You can see the process in the latest video on YouTube!
https://www.youtube.com/watch?v=aoB7fOTkR0I&feature=youtu.be
Have a nice trading week.
Claus Andersen
AIL = Always In Long
BO = Breakout
FBO = Failed Breakout
PB = Pull Back