By Claus Andersen
15. March 2019
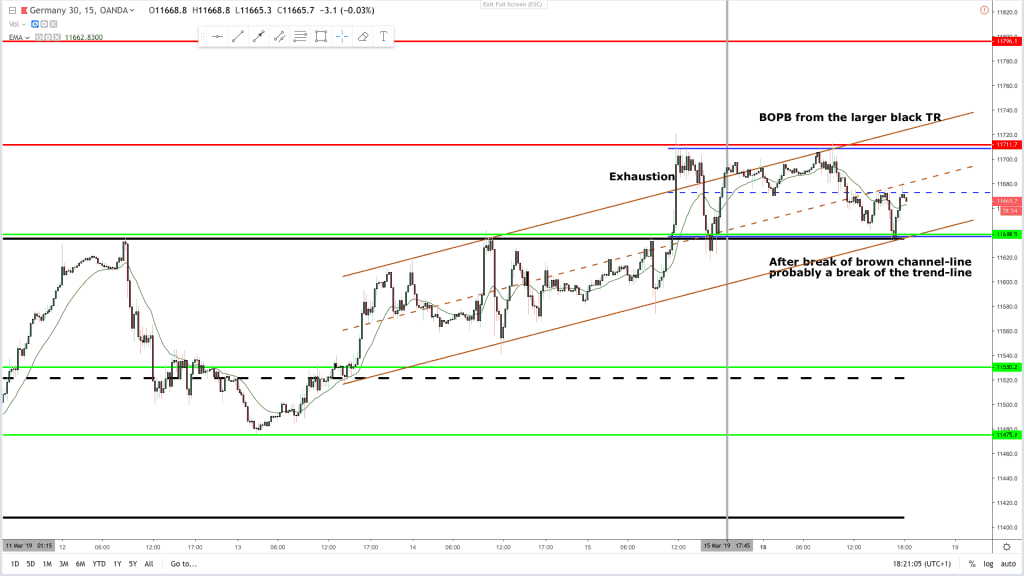
A lot going on in this 15 min chart. During exhaustion in the final day of last week price broke above the prior high, and the high of the black trading range. Now price is trading with old resistance as new support. That is a classic breakout pullback long pattern.
Also on the exhaustion price broke the channel line of the brown bull channel. When a channel line is broken the trendline is often broken shortly after. That has not happened yet. Price bounced on the trendline today, but it could easily break it still.
Third- price is trading in a new blue trading range. That fact makes this a trending trading range context. And price will probably keep on trading sideways, and after a BO continue in a new trading range.
All of the above scenarios are in my opinion valid. So how do we trade it?
Well buy of setups at support, sell of setups at resistance. Don’t be surprised if price breaks the brown trendline. And when trading up into a trading range, probably price will break out to the upside. And still price can break back into the black trading range and out the low side for a larger bull trap.
If it was easy, anyone could do it. Stay small and nimble.
New support and resistance levels on the chart.
Have a nice trading week.
Claus Andersen