By Claus Andersen
08.
Long time no see. Back on track. Since it has been so long, I’m going to do a top down on
DAX monthly, weekly and daily. Just to give you an idéa what I’m watching. Next week I’m
going to go through areas to look for trades on shorter term. Performance wise I had a
drawdown in August and September. Oktober was better. Soon I’ll do a performance status
video.
Monthly chart:
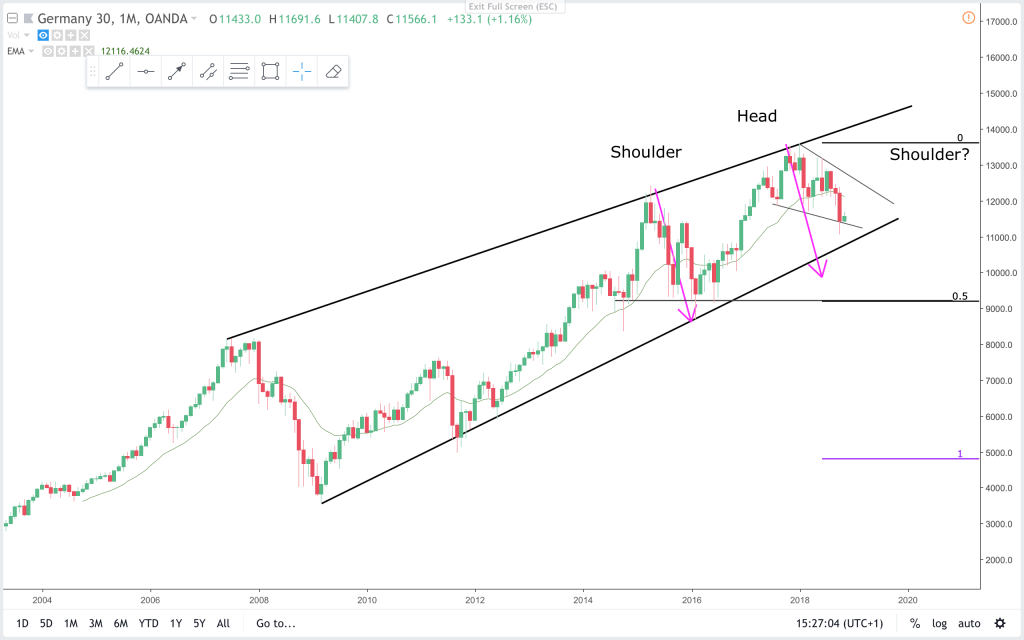
On the monthly price is still within the bull wedge channel. Price has still not tested the
trendline. And for the price to reach a measured move based on the pullback in 2016, it has
to go and test below 10.000 again. I drew in a potential pattern in the making. 80% of head
and shoulders never trigger or fail, and simply become flag patterns. More likely that price
will get a third leg down in the minor bear wedge and test 10.000 again. I will discuss this
below.
On this chart price is still always in long. And I would look for patterns to get long.
Weekly chart:
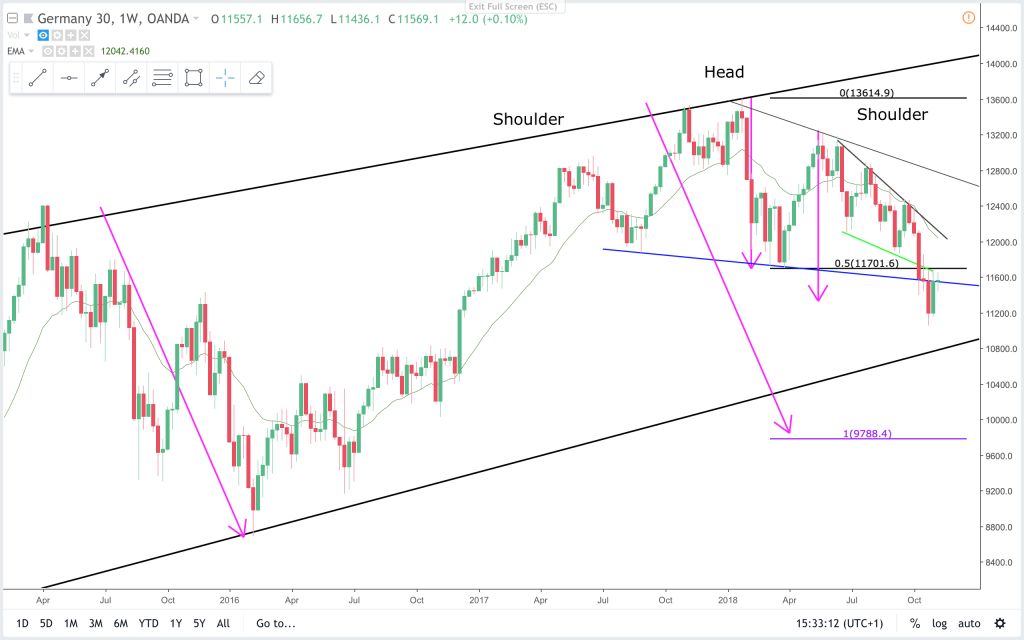
On the weekly chart the bull flag wedge is more clear. On this chart price has broken below the support of the wedge. The bar that followed the BO bar was a bull bar. That looks like a two bar reversal after a bear climax. I would expect some weeks sideways to up trading from here on. And potentially a third leg down after those weeks. We will have to see as time passes. There is a small chance that price just drops down on this break out.
On this chart price is in trading range price action. It has made a reversal head and shoulders pattern. If the head and shoulders breakout lower succeeds then the target is below 10.000(9.788 ish). If it fails probably price will test the resistance of the wedge pattern again. A wedge is a BO pattern. Especially after this long. 50/50 on direction. Perhaps a small favor to the upside on the grounds, that we traded up into the range.
Daily chart:
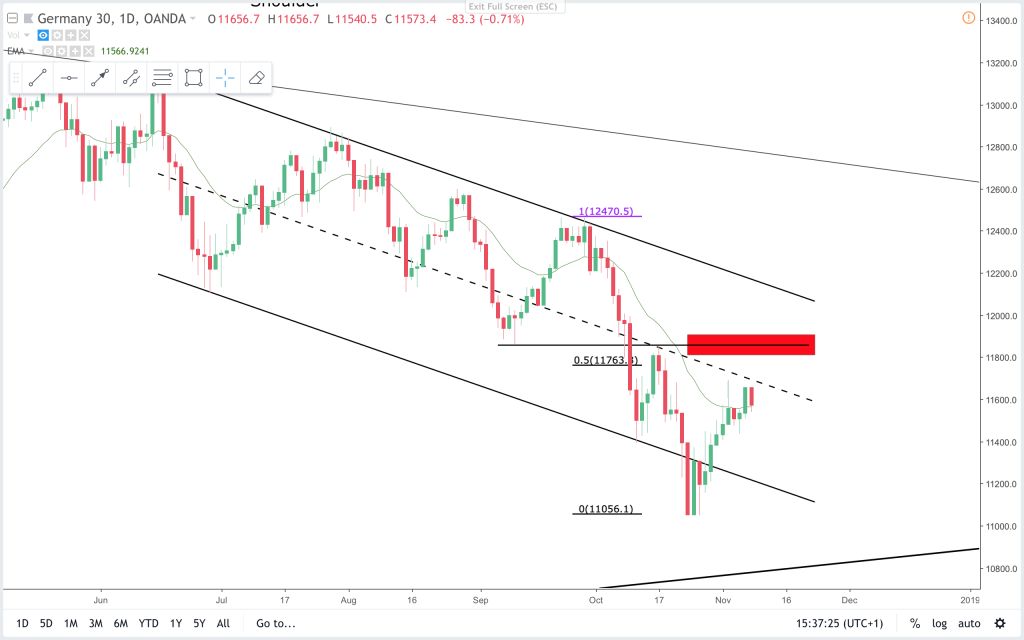
On the daily chart price is always in short and one could look to sell if a setup forms. Price broke below a bear channel line. Two scenarios on this break. First bears are stronger and the breakout is the new channel line support(fits with midline, and not the one drawn in here)
Second scenario is that the last bear leg was a exhaustion. And now price will correct in two legs sideways to up. In the last case there is a resistance area at the redbox. That is where I would look to sell if we had the second leg by then. I would be carefull going short unless really strong setup and signal bar.
Price is always in short but could test bull strength in the coming weeks.
I’m glad being back making analysis and contributing to the community that has given me so much when I started trading. Major patterns such as on the timeframes discussed above are good practice for reading price action. But on the shorter day-trading time frames they rarely worth making decisions from.
Claus Andersen