By Claus Andersen
11. March 2020
Weekly min chart:
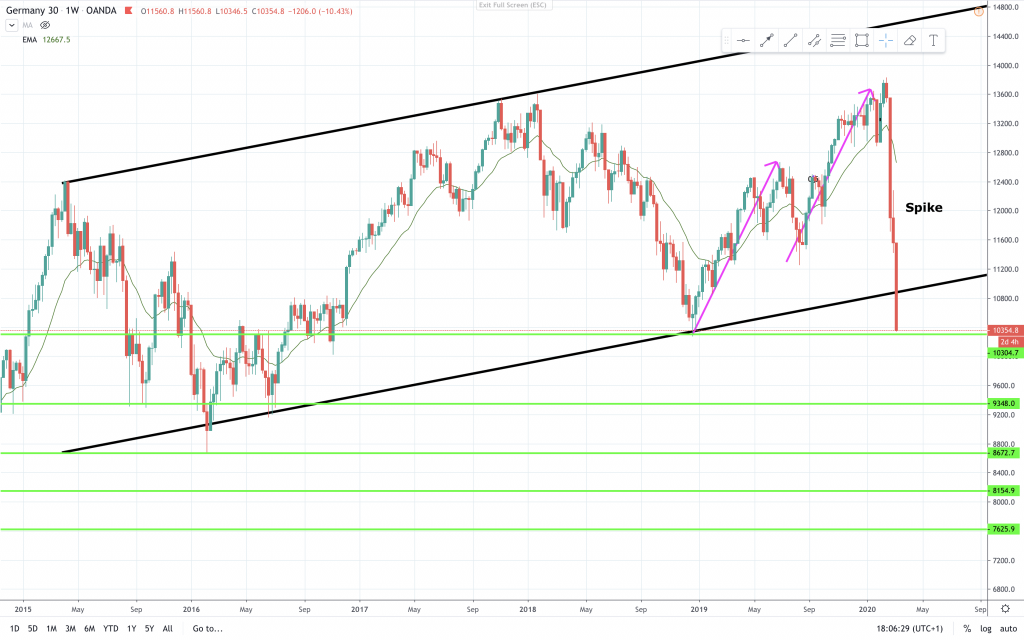
Last week: ”That would mean a drop below 11.000”, “A test of 10.000 is not unlikely from a technical perspective.”
Looking at the corona Covid-19 virus infection numbers, I don’t even think we have seen the panic yet. But time will tell. Probably we will see a bounce when they announce a vaccine, but then it will get known, that it will take approx 18 months to produce and distribute the needed quantities.
Price is at the writing of this dipping below 10.400. Support levels is drawn in green on the chart. Support and resistance is areas and not definite lines. Always in is short. Here are the support numbers for the major areas.
10.300
9.350
8.675
7.025
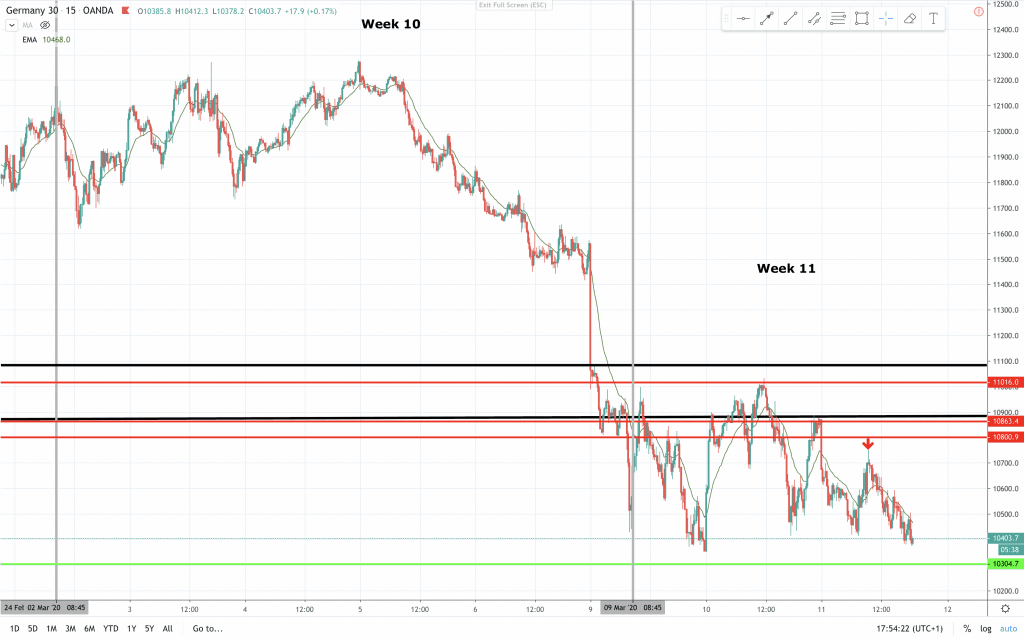
15 min chart:
// DAX 2-2
On the 15 min time frame we as a large sell off last week. Into this week all of the trading so far has been sideways. Potentially a shift to trending trading ranges or a wider bear channel. I do not think the correction is over. All minor support is broken. Sell at key entry areas is my plan. Be prepared for more volatility.
Trade smaller and more carefully when volatility is this high.
A bit more detailed analysis in the video below.
Support and resistance was adjusted in the latest YouTube video:
Let’s level up together 📈
Claus Andersen
AIL = Always In Long
BO = Breakout
FBO = Failed Breakout
PB = Pull Back