By Claus Andersen
11. December 2019
15 min chart:
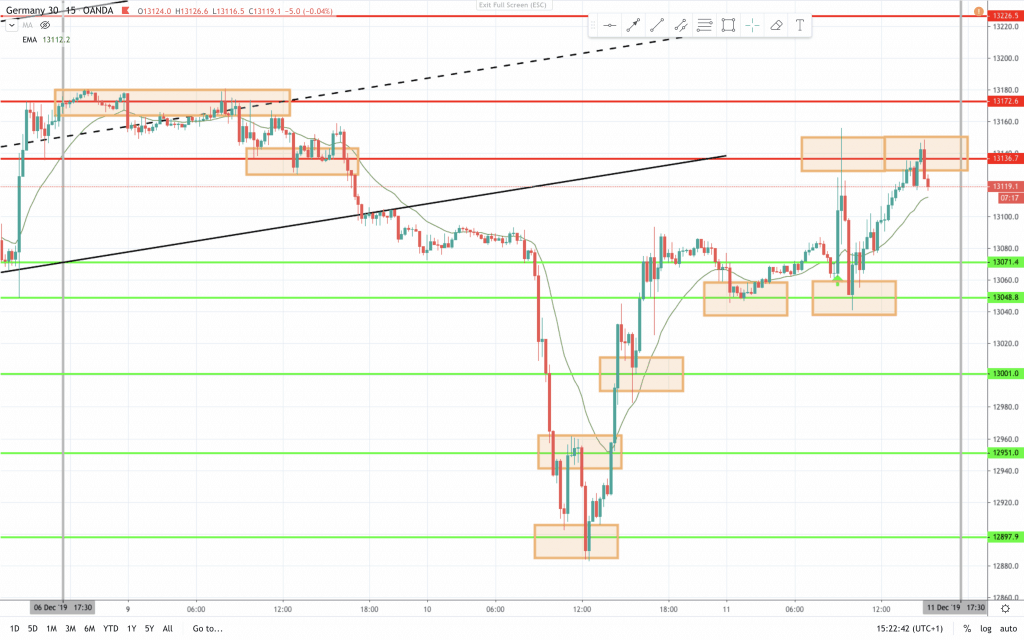
Price action trading is all about context. When trading from a candlestick chart pivot high and lows tells a story about support and resistance. In this chart of the DAX or GER30 you see support below(green lines) at prior pivot lows and resistance above(red lines) at prior pivot highs. All that means is, that the price has a history of bouncing or changing direction when traded around the support or resistance. And the is why we expect a reaction the next time price runs to an area of support or resistance. In the 15 min chart of this weeks first 2-3 days you’ll see how the support and resistance areas worked this week. It is NOT a sure thing. Almost all support and resistance areas get testet and / or broken. But it is likely that price will react in those areas.
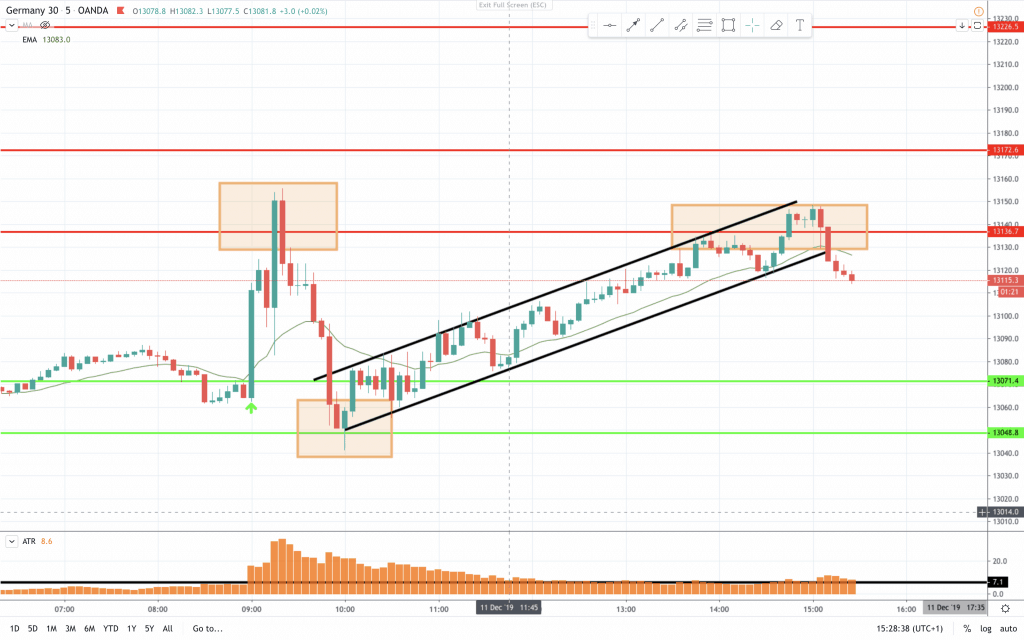
In the 5 min chart above you see some of the reactions price got at resistance and support. First a two legged move up and a bear reversal bar at resistance. Second A sell climax that broke one support area and printed a bull reversal bar at the next. Third a resistance area where the pullbacks became large enough to break the bull trendline. Both of the tests gave room enough for a 10 point standard DAX scalp.
https://www.youtube.com/watch?v=NQ3uxPCqUCQ
Have a nice trading week.
Claus Andersen
AIL = Always In Long
BO = Breakout
FBO = Failed Breakout
PB = Pull Back