By Claus Andersen
22. April 2020
240 min chart:
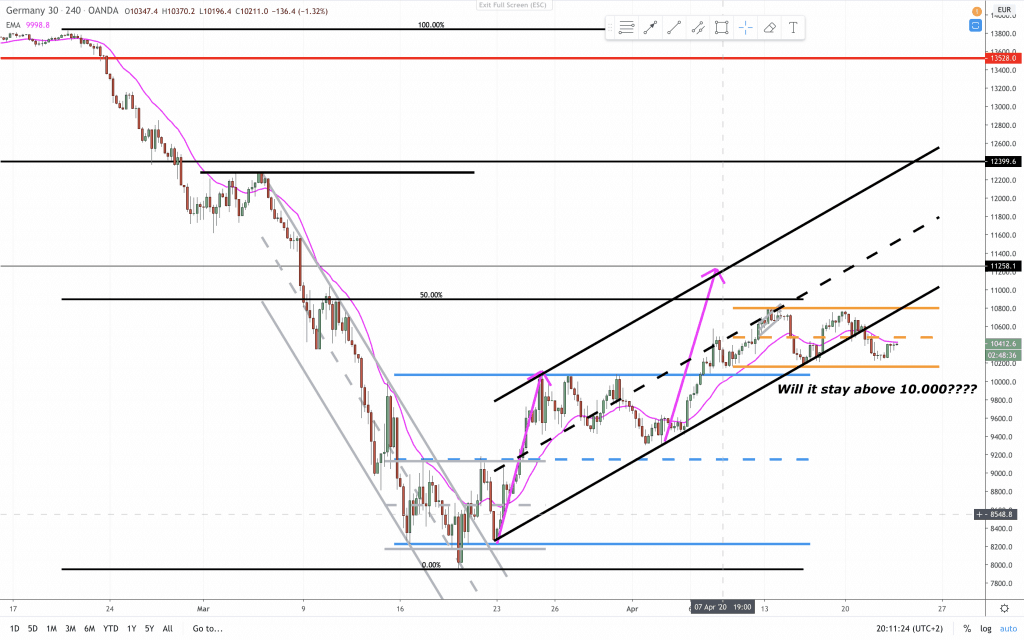
LAST WEEK: “The bears look strong on this 4 hour bar chart. The 10.000 mark could be the magnet.“
Price in the DAX (GER30) has settled in the orange trading range. It broke the bull trendline and failed to reach the measured move to the upside. That is a sign that context will change. And context has changed from bull trend to trading range. The latest development in the oil price could rub off in a more negative expectations in the stock markets and falling prices. The pandemic corona crisis is far from over, so that could also be a catalyst to another selloff.
Always in is sideways and price has reacted nicely on key support and resistance areas.
15 min chart:
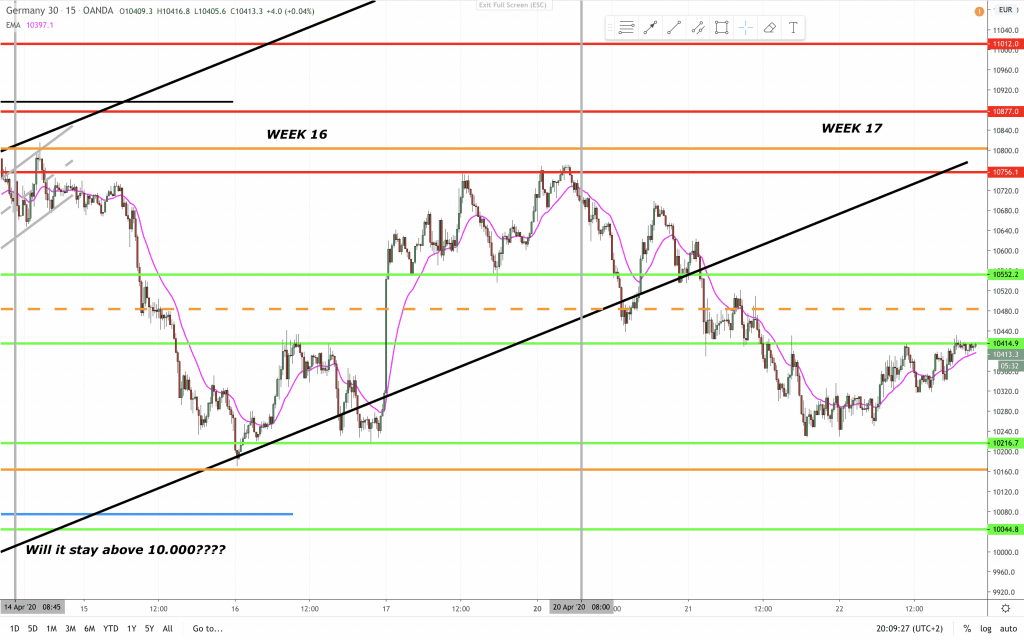
LAST WEEK: “That tells us, that large scale traders are still willing to sell.“
Since last week on the 15 min chart price sold off and bounced then sold off again. There seems to be some hesitation. The trading range is nice enough in that it is not too hard to trade. Still I am watching for that 10.000 price point. As long as price keeps above it, then I am more positive.
A bit more detailed analysis in the video below.
Support and resistance was adjusted in the latest YouTube video:
If you are not following us already on FaceBook here is the link:
Let’s level up together 📈
Claus Andersen
AIL = Always In Long
BO = Breakout
FBO = Failed Breakout
PB = Pull Back