DAX, Price Action
By Claus Andersen
19.December 2019
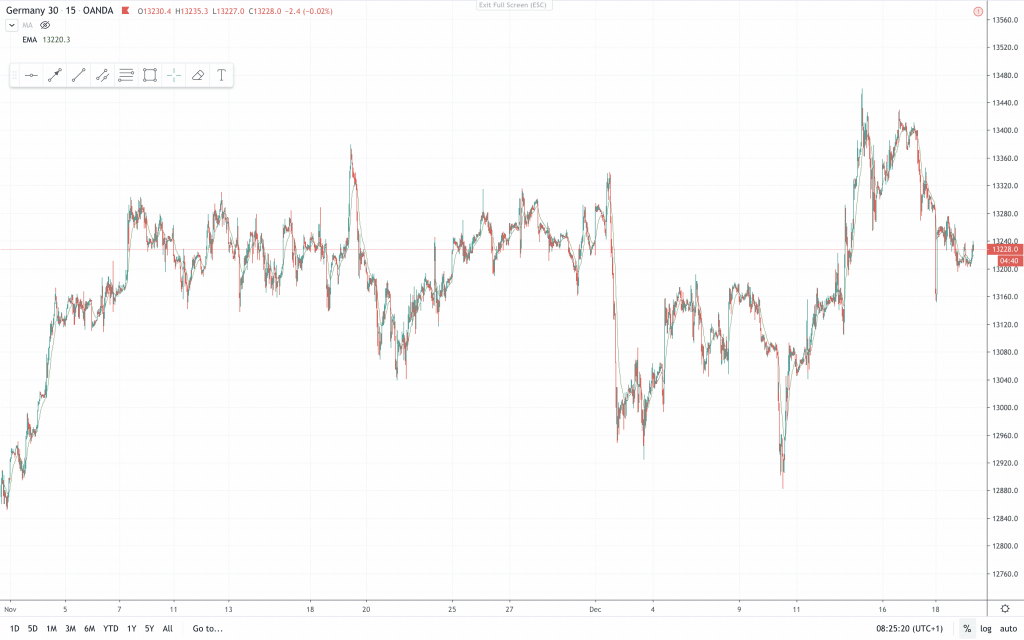
15 min chart
This is price action since the start of November on a 15 min candlestick chart. It should be clear to all that price is trading sideways. We had a couple of attempts to break out to both sides, but there was no follow through on either side. Where does that leave us traders guessing what will happen next?
Things to consider in this context:
Price traded up into this range, that favours a BO to the upside.
Price has traded sideways for a long time now, and have had failed BOs in both directions. That makes a directional BO around a 50:50 probability. Most recent we had a bull leg and a 50% retracement of that leg. That favours another bull leg up. The bull leg could also be a failed BO double top and a bull trap for a move down.
All of this tells us that the direction is unclear. When direction is unclear trade it like a trading range. Right now price is at the middle of the major trading range, so sell high, buy low and scalp.
Have a nice trading week.
Claus Andersen
AIL = Always In Long
BO = Breakout
FBO = Failed Breakout
PB = Pull Back