By Claus Andersen
24.December 2019
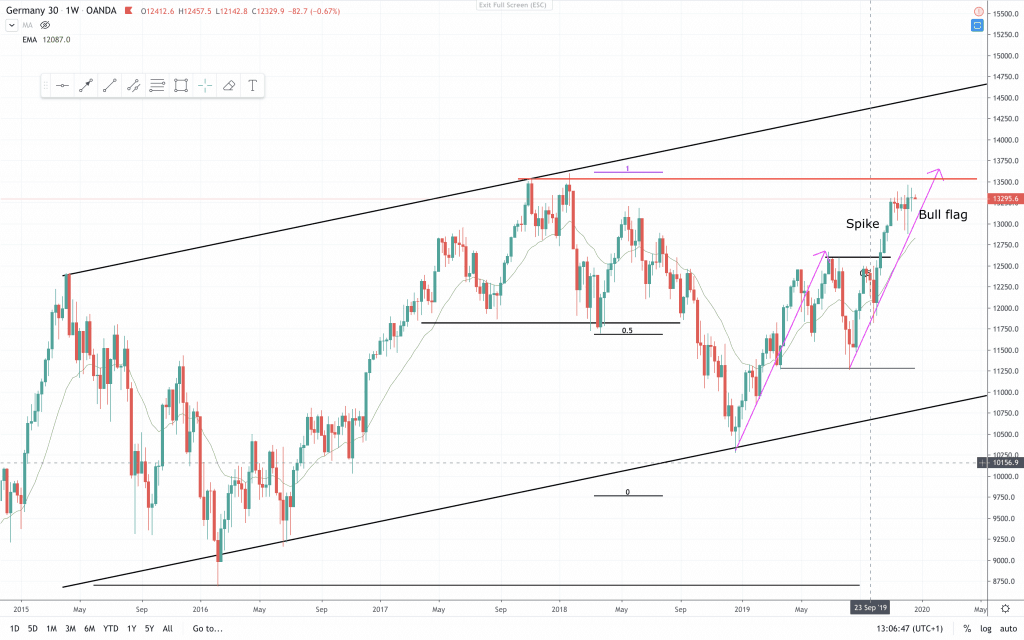
Weekly chart:
As the year comes to an end we take a look at the higher time frames. On this weekly chart the price is in a bull trend. At least this year. Higher highs and higher lows. Now price is pushing for another test of the all time high. My guess is that we will see the attempt to push higher, and a move to the channel line. If price fails to reach the channel line, then it is likely that it will break the trendline below. That would be a large drop in the DAX. If price “only” makes a 50% retracement from the all time high(red line) on this years bull leg, then it would be a 15% retracement. A new major low would mean more than a 30% retracement. It is not unlikely. I think there is a bit more to the upside before that happens, but you never know.
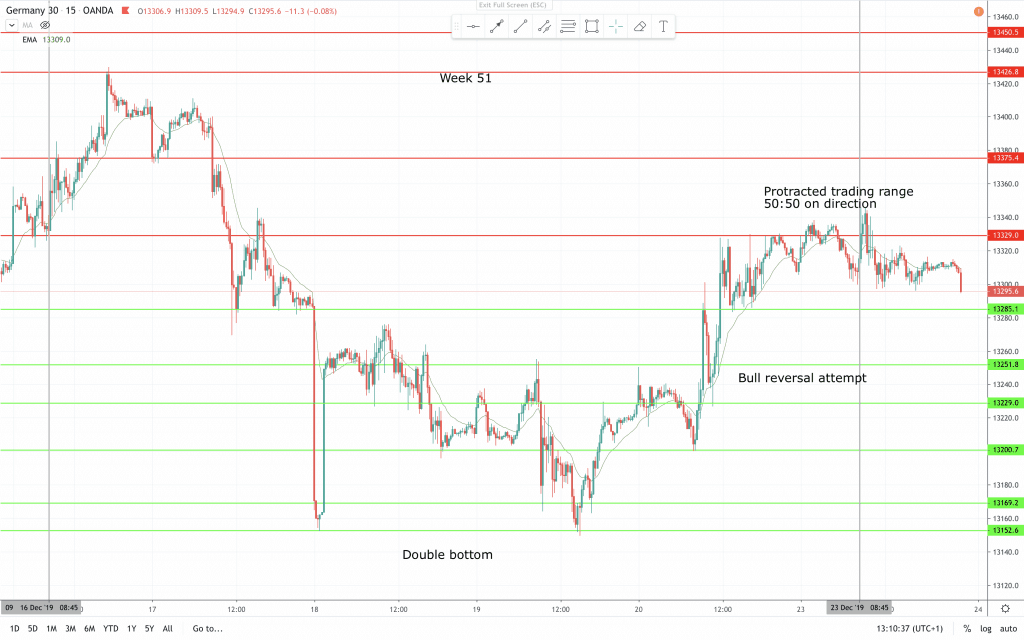
15 min chart:
Last weeks 15 min chart is interesting. Spike down and up on the 18th. overnight made the first low of a double bottom. Price action analysis wise that was a exhaustion move. It was followed by a re-test, and that became a reversal. Nice and clean price action. The bulls reversal attempt is still on the way. Price has stalled in a protracted trading range. It looks both like a wedge, a diamond and a trading range pattern. What it really is is a place of equilibrium between bulls and bears. A distribution area. Both bulls and bears find value here. Eventually there will be a BO. Probably a trap, but we will get the answer before January I think.
Support and resistance was adjusted in the latest YouTube video:
https://www.youtube.com/watch?v=thkkPRMNhME&feature=youtu.be
I wish you all a happy holiday.
Claus Andersen
AIL = Always In Long
BO = Breakout
FBO = Failed Breakout
PB = Pull Back