By Claus Andersen
8. April 2020
240 min chart:
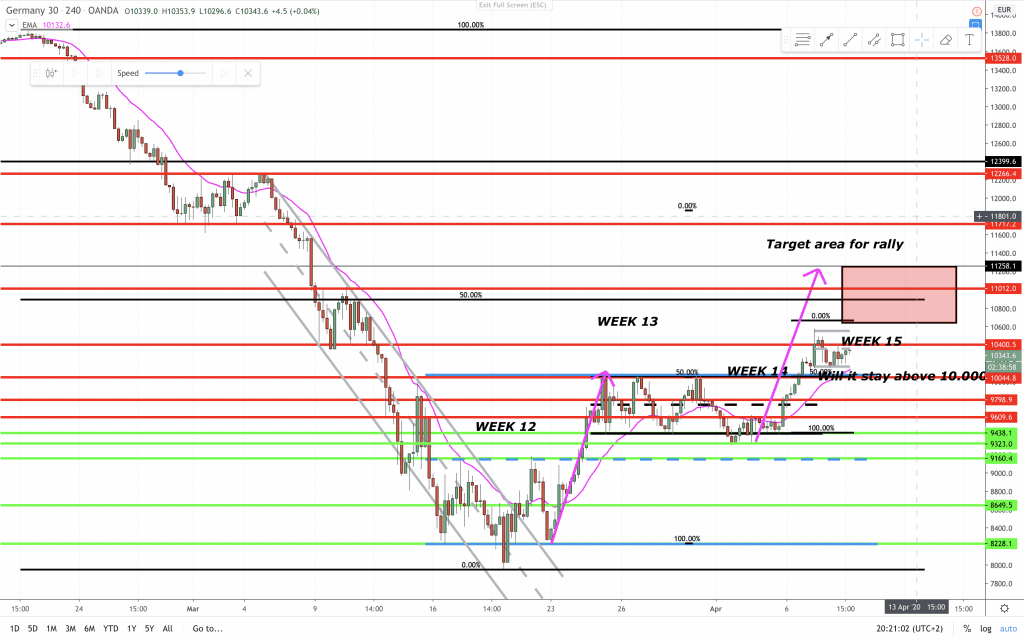
This four hour bar chart is nice to look at from a technical perspective. The bear trend down, the reversal pattern, and now the potential two leg correction. The red square could be a nice area target area if long. Or a place to go short it the right price action setup formes. If price fails to reach the measured move target it could be a sign that we are going lower.
15 min chart:
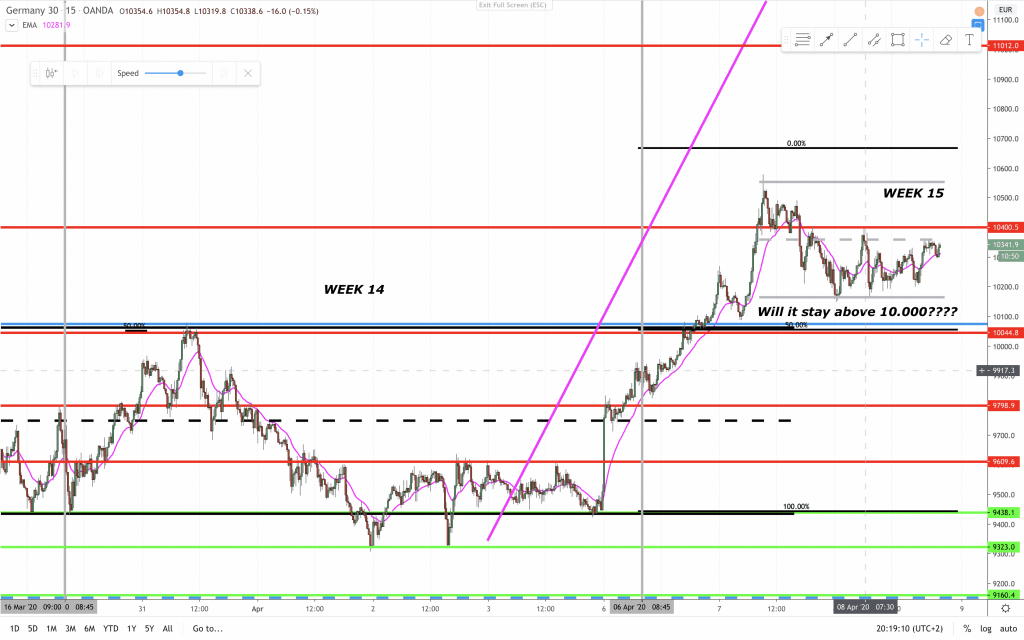
Things are moving along nicely. Price was trapped in the black trading range. below 10.000 and above 9.500. Price made a failed attempt to break lower and formed a double bottom. Then it rallied to break out the upside. That was the trap I talked about in the video linked below. The grey trading range this week is a breakout pullback long pattern. I do not like the hesitation and would like to see the follow through to the upside soon if convinced that we will stay above 10.000.
A bit more detailed analysis in the video below.
Support and resistance was adjusted in the latest YouTube video:
Let’s level up together 📈
Claus Andersen
AIL = Always In Long
BO = Breakout
FBO = Failed Breakout
PB = Pull Back