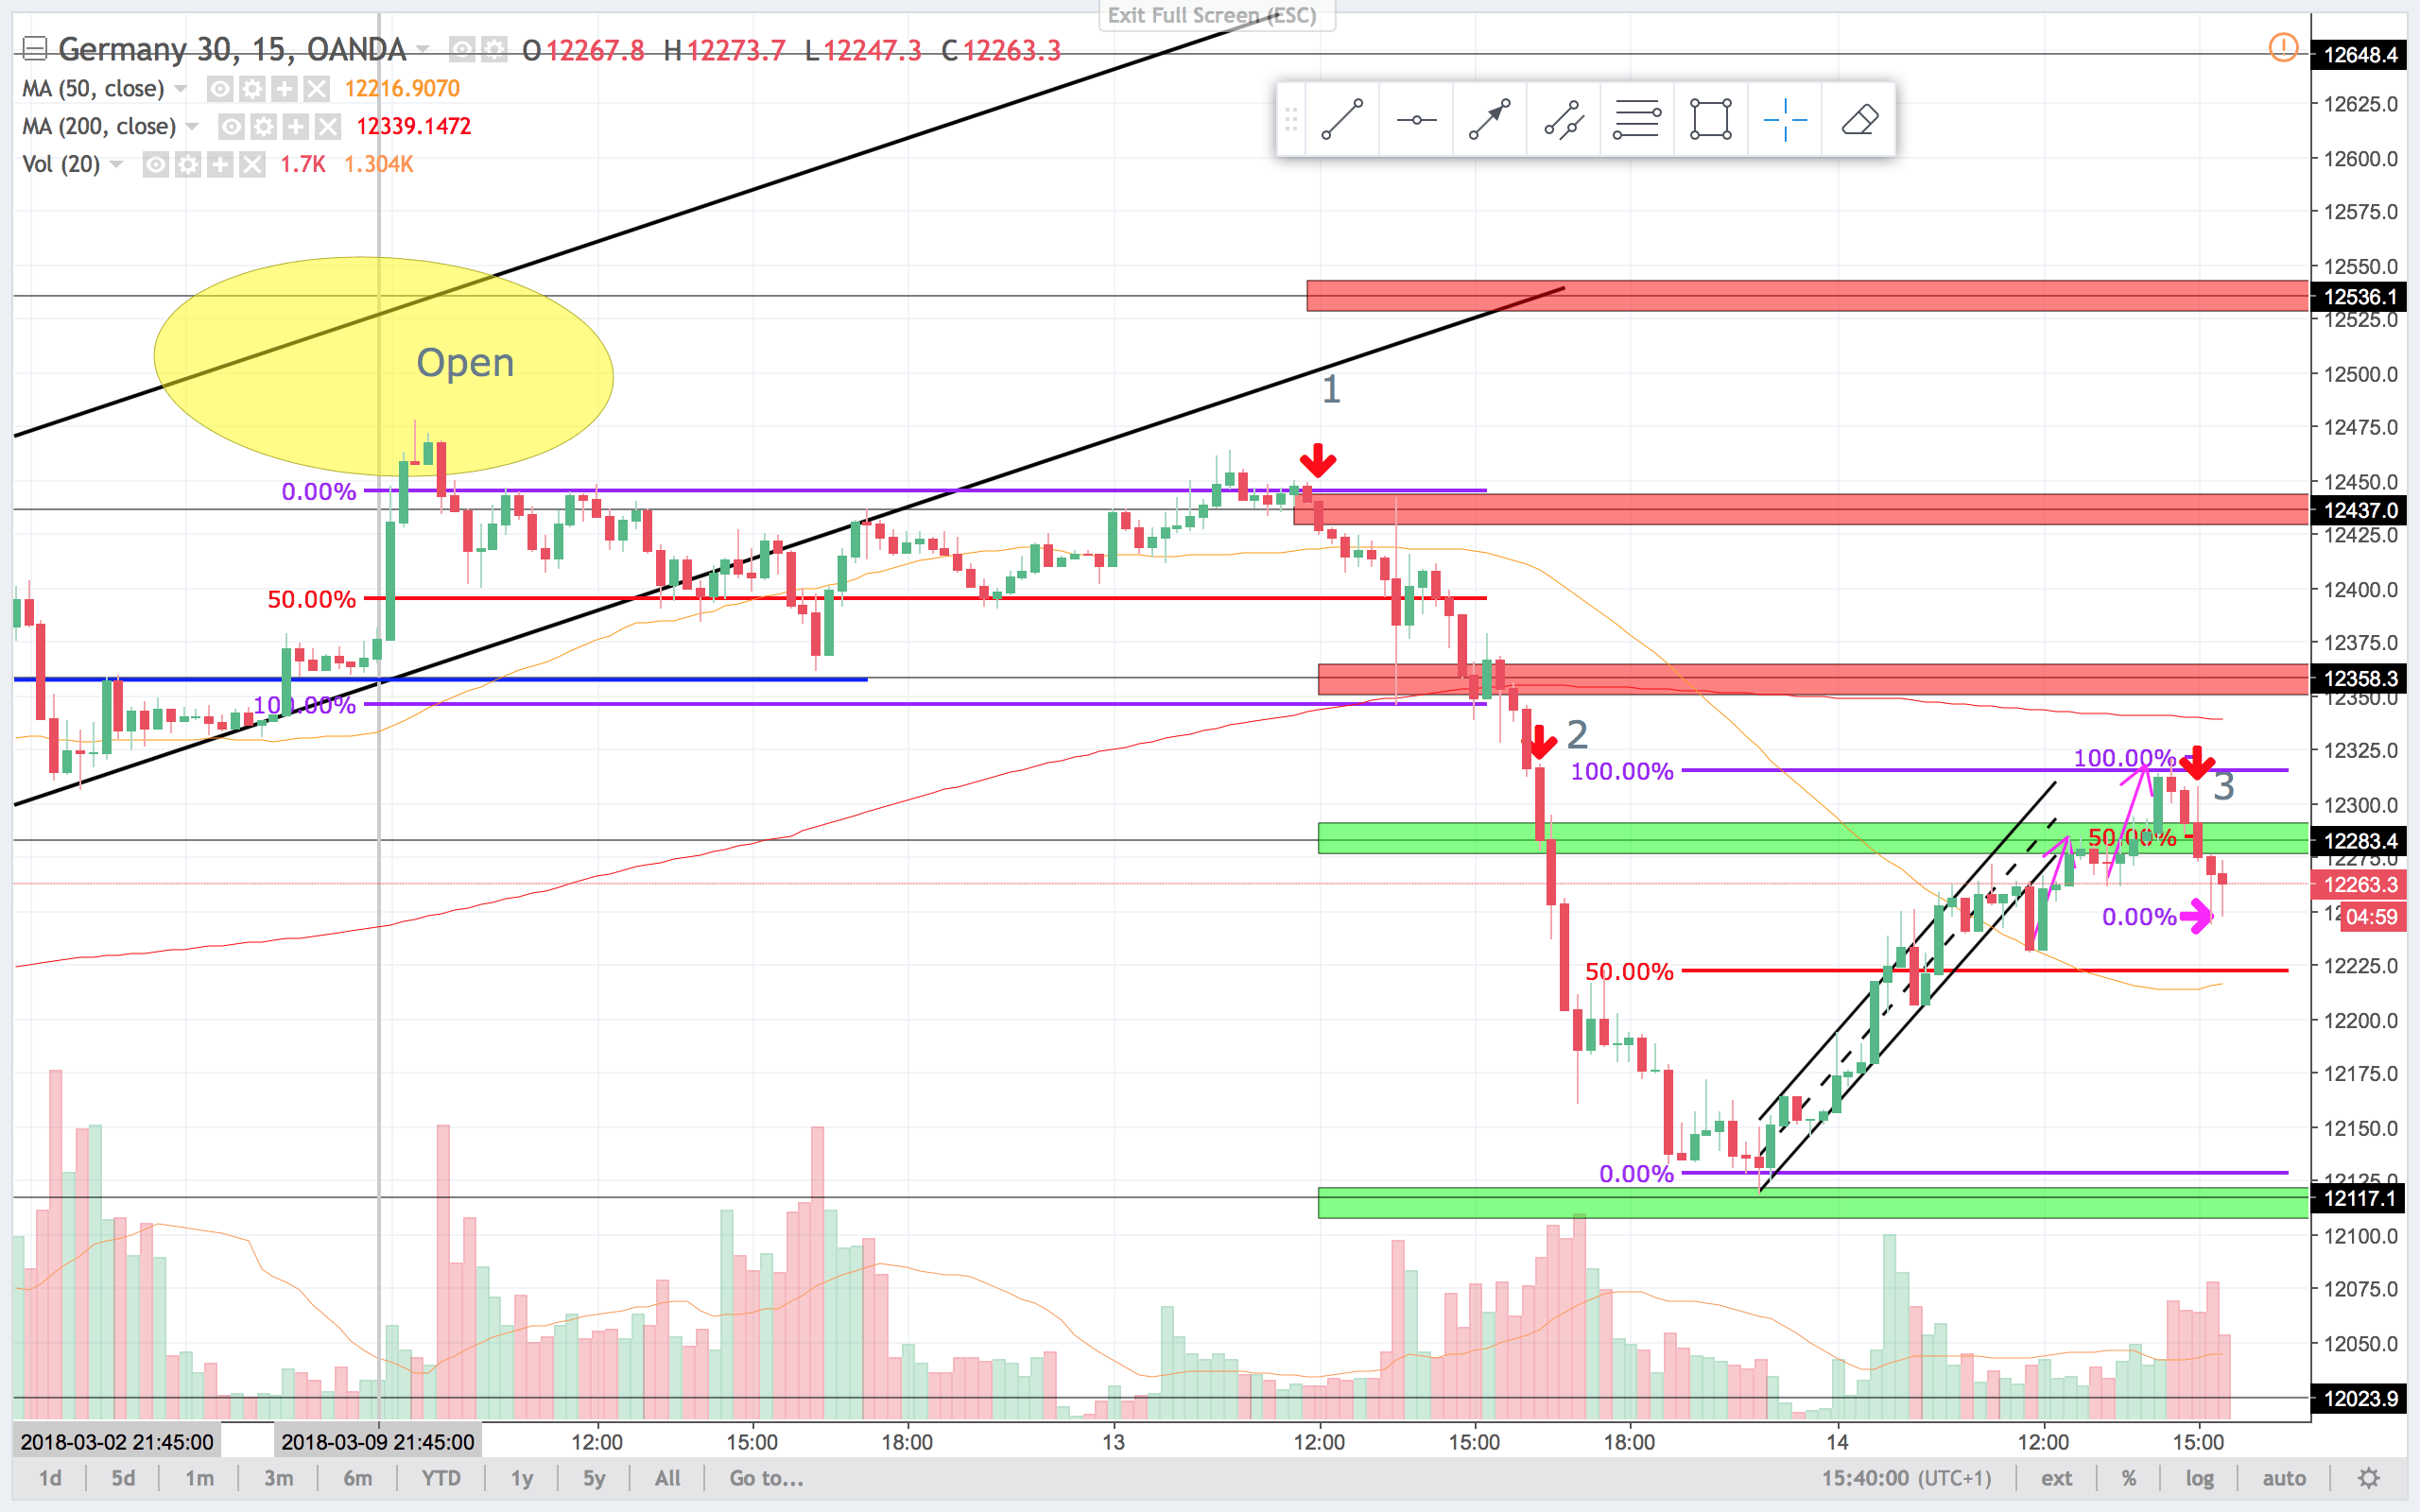
On the chart above you see, that price failed to reach the channel line (Yellow circle). This is often seen in the end of a trend move. Price traded sideways and broke the trendline. After a trendline break often you get a retest of the highs, witch is also the resistance in this case. And that often happens in a two push pattern. The second push was completed on the high before the first marked trade (1). Then there was a good probability that price would retest selling strength. Probably to the low of the trading range (between the 0,00% and 50.00% lines. When it broke lower, a measured distance support area was reached (100% line) and price bounced up. Then we got a strong breakout below the support line. Strong momentum down. Price finally found support at 12.120 ish. Made a double bottom and started correcting up. The correction ended with a break of the trendline and a two push move to retest resistance(same pattern as before). Here I marked trade nr. 3 and 4(not shown in 15 min chart).
Notice how I drop down on the timeframes below.
1
This setup was a lower high after a trendline break and a retest of buying strength. Playing the upper trading range for a scalp or potentially a larger correction.
2
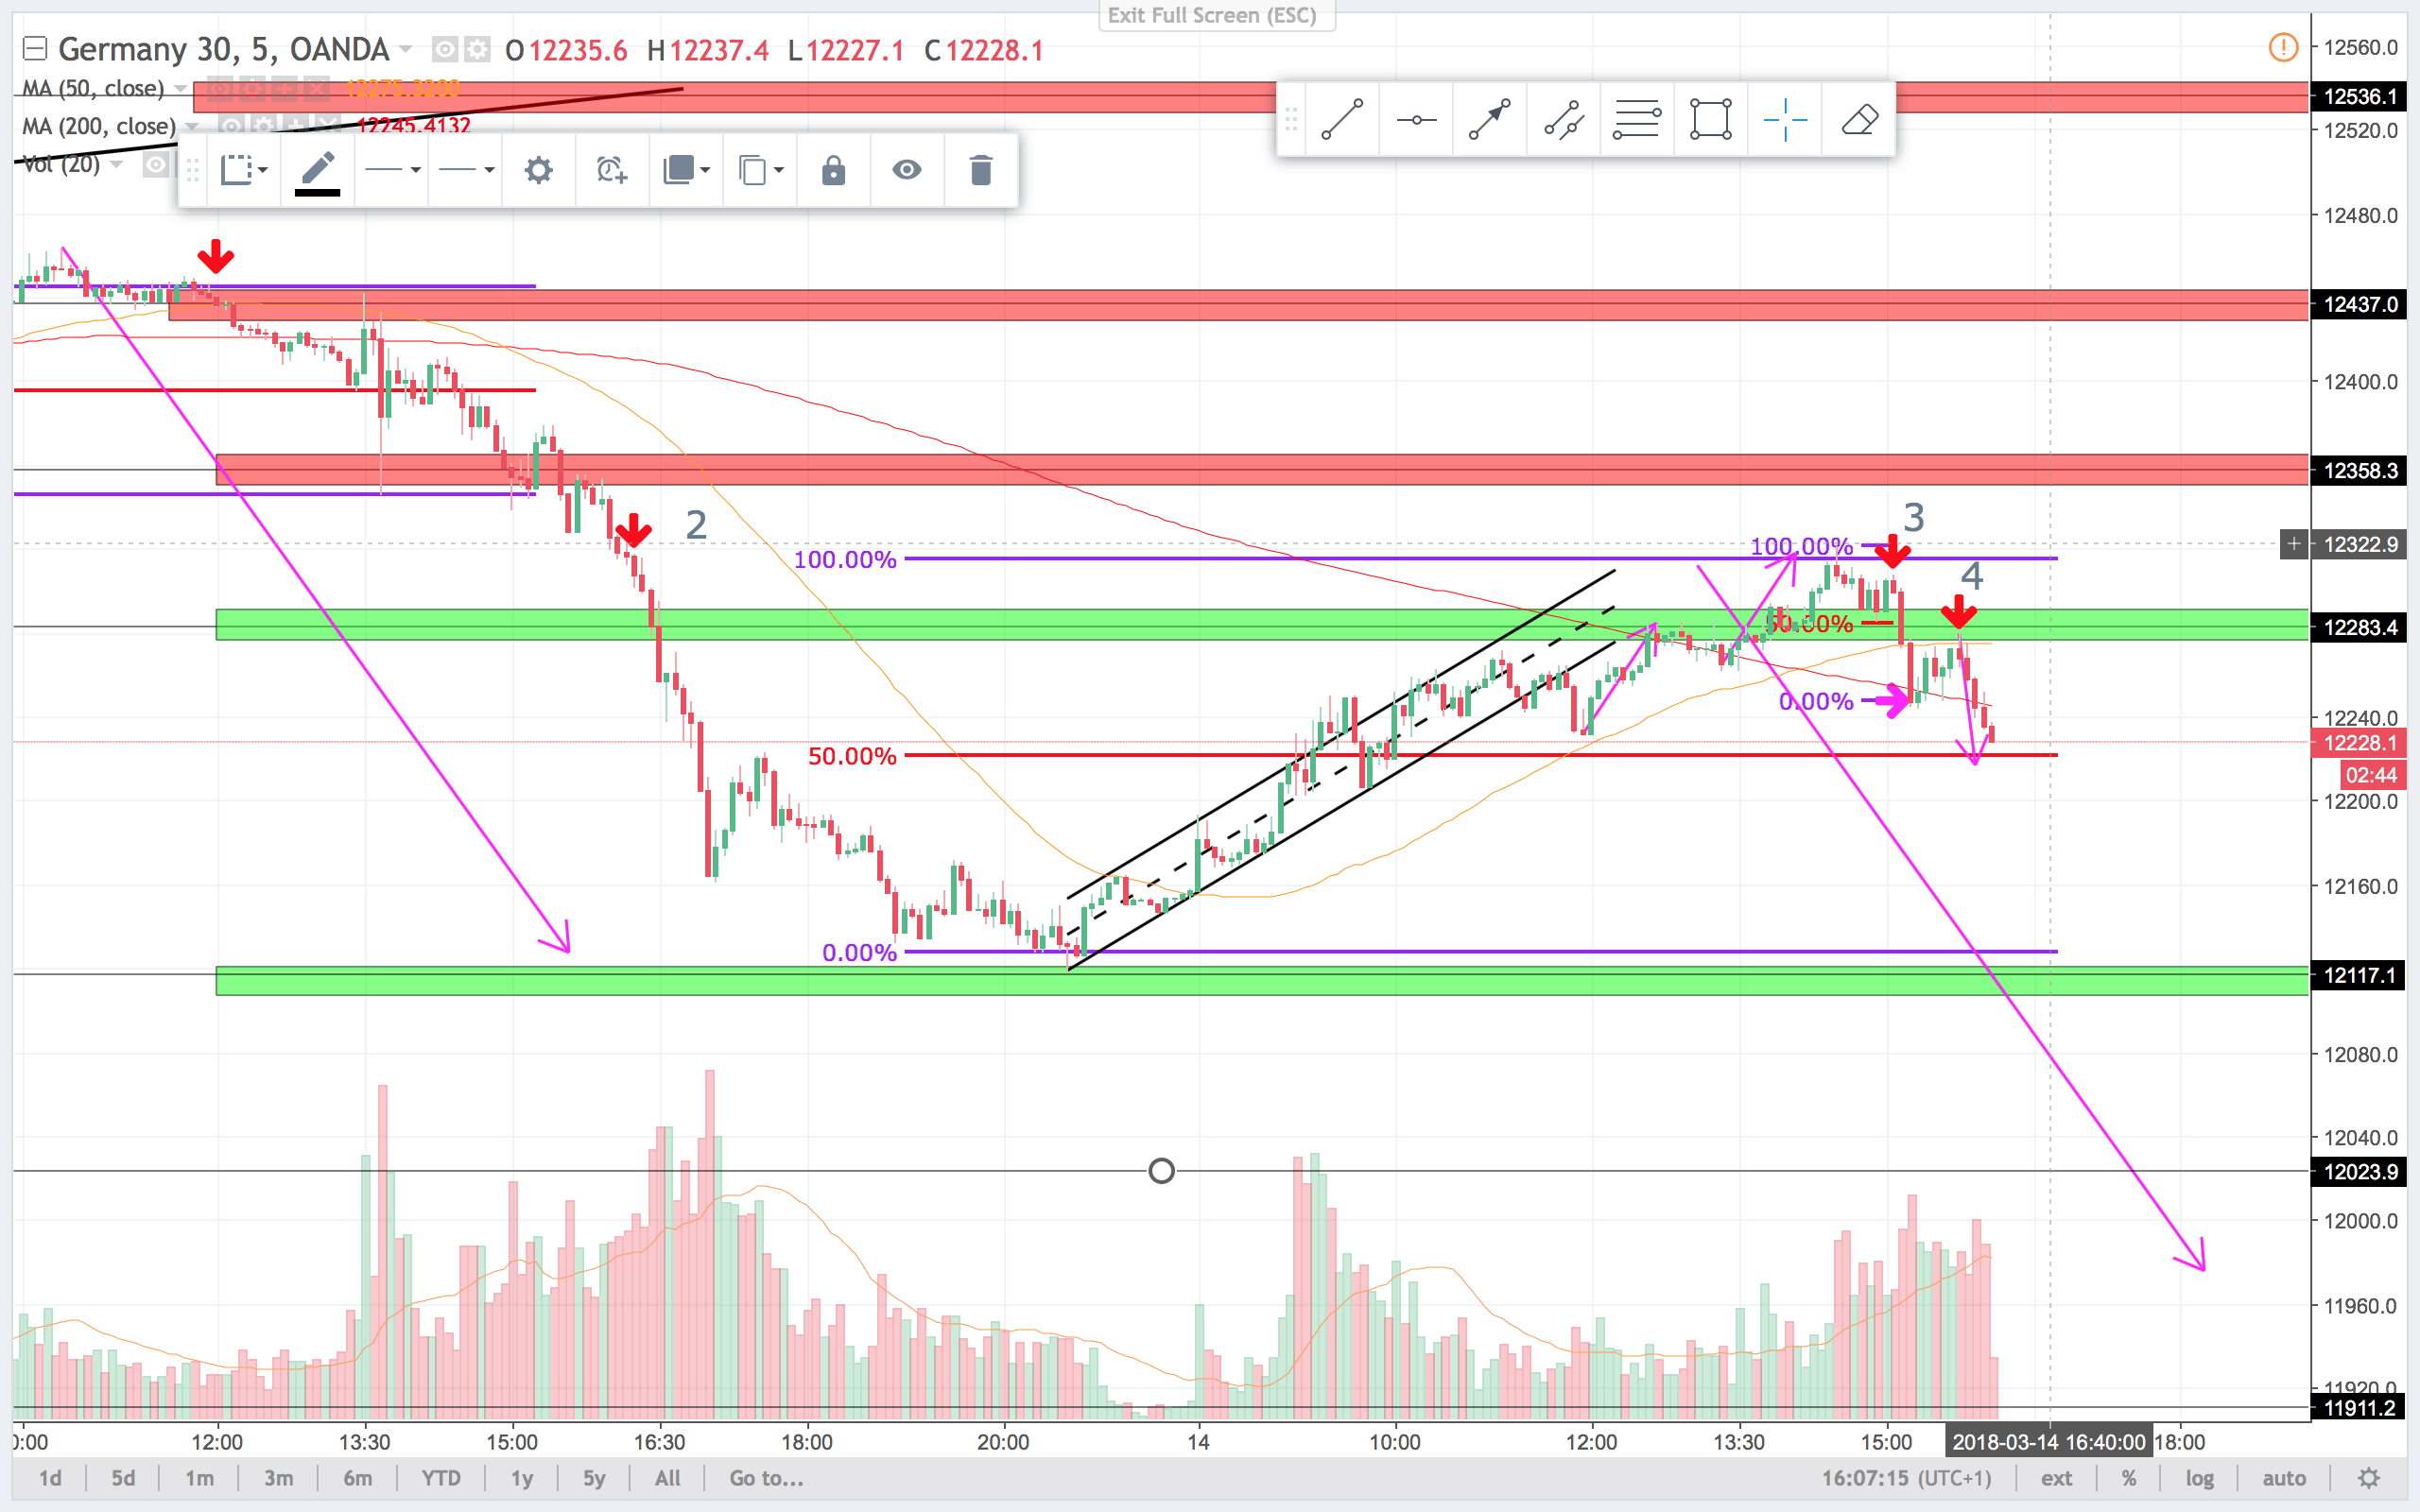
When price has got this kind of momentum, you can make money selling anywhere for any reason. Sell closes, sell new highs. Drop down on the timeframe and sell above small corrections.
3
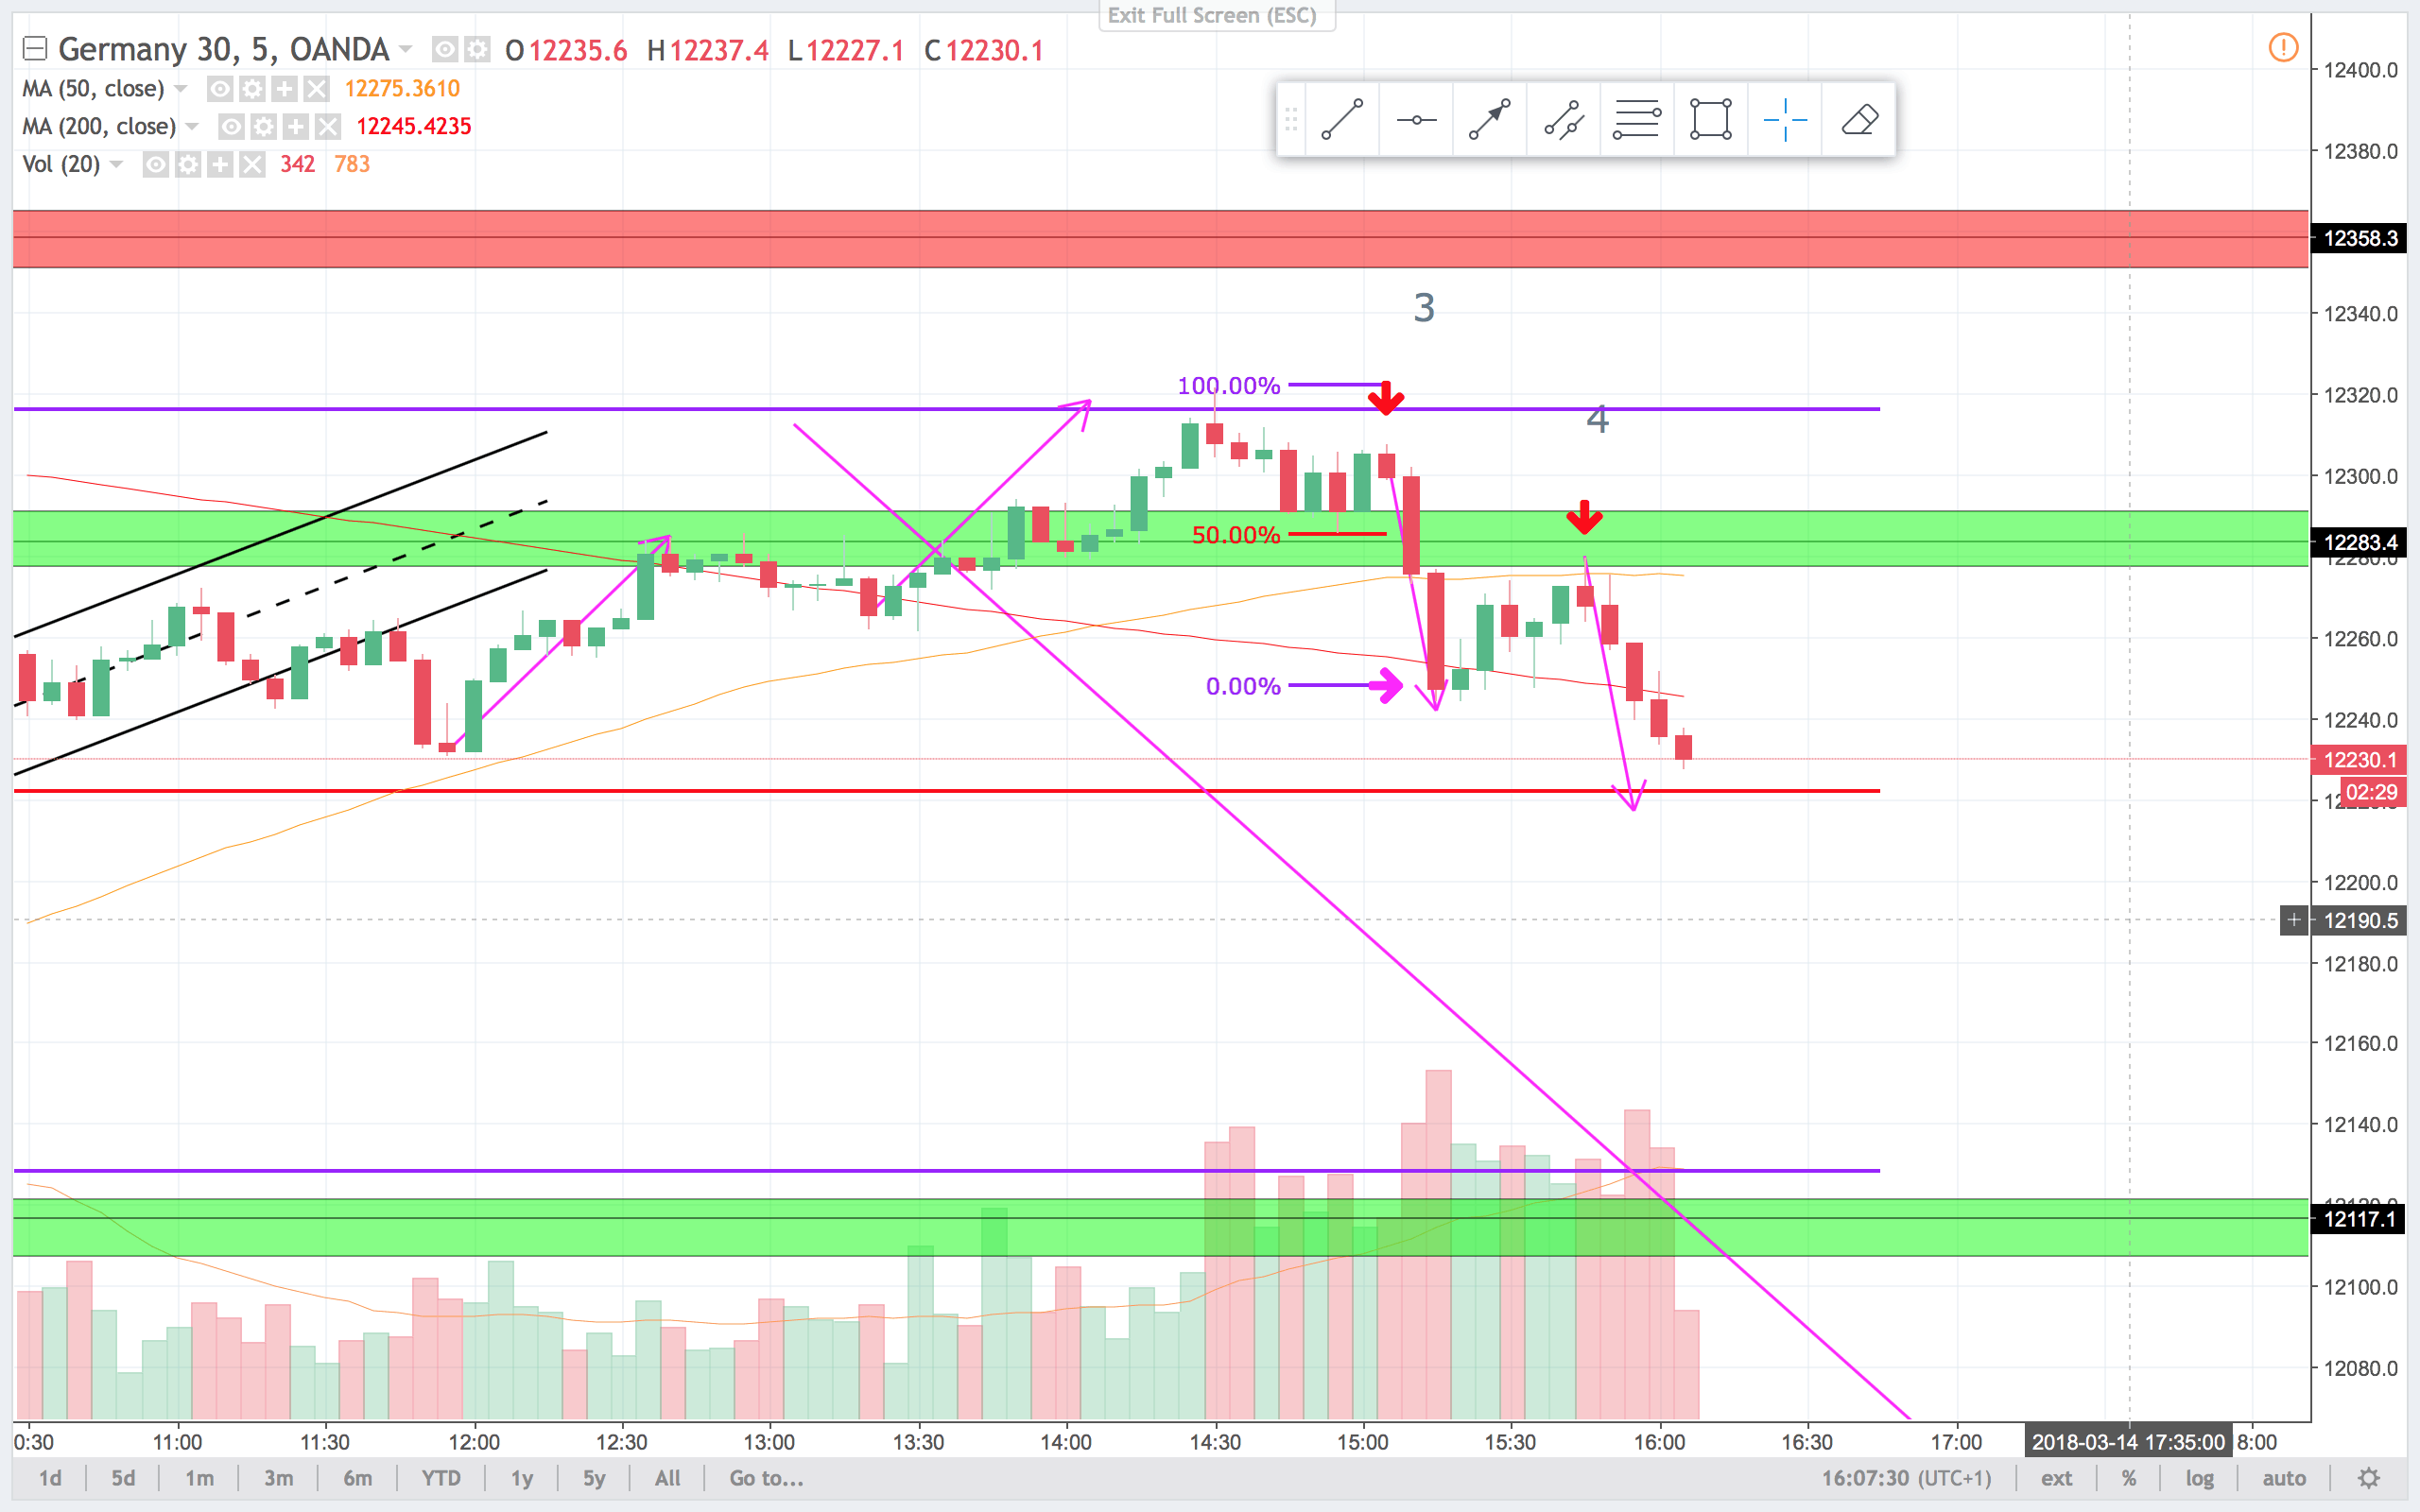
The bull correction ended as described above. The bull bar before the signal bar(red arrow) was strong bull bar closing on its high, and signal bar followed was a small bear bar micro double top and a lower high off resistance in a possible reversal on a higher timeframe. I like to risk that for a short. Or you could wait until price dropped below the 50% line, and made a bull trap. Initial target was a measured move expansion of price to the 0% line.
4
This trade was nice. The two strong bear bars from the initial breakout made me think, that there was a great probability of a retest of the 0% line. The signal bar below the red arrow at the 4 was a second entry short breakout pullback short, sell signal. Second target was the measured move arrow.
I hope you made money this week so far.