By Claus Andersen
20. May 2019
15 min chart:
Last week I mentioned that a test of 12.000 was likely. A round number like that is often tested after a break. That is what we got, and more. Sellers had the strength to push the DAX all the way down to support at the 11.850 area. Now what is happening? The bears are covering shorts and bulls getting long. For how long? There is a chance that the selloff is a bear BO, followed by a PB(the rally to 12.300 area), then follow through for more selling and new lows. Or a failed break lower and a larger timeframe bear trap. More likely I think is sideways market above and below 12.000 area. A protracted trading range. Today we saw a large drop in price. But a bounce at 12.000. I will look to see if this area will hold, or not. It is a good place for longs if the right setups forms. If it breaks lower look to see if the break fails.
It is exciting times in the DAX. Large moves make for large gains. Hope you all are getting some.
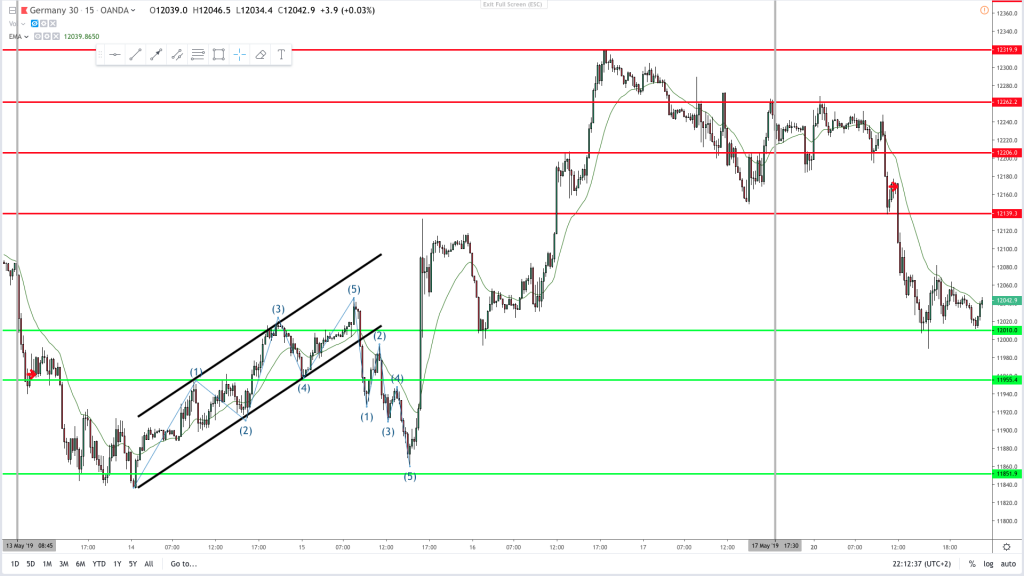
15 min chart:

I drew in two examples of three push patterns. When they complete(at the (5)) I expect a reaction in the market in one way or the other. That makes for better risk reward. And when it completes at support and resistance you can look to get better probability as well.
New support and resistance levels on the chart.
https://www.youtube.com/watch?v=70atE4sAJgs&t=127s
Have a nice trading week.
Claus Andersen